SharpCharts Voyeur
Our SharpCharts Voyeur tool displays a random selection of charts that our members have recently created. This is a great way to see how other members are setting up their charts and what charts they are looking at.
SharpCharts Voyeur can be accessed from the “Additional Tools & Reports” section of the Charts & Tools page.
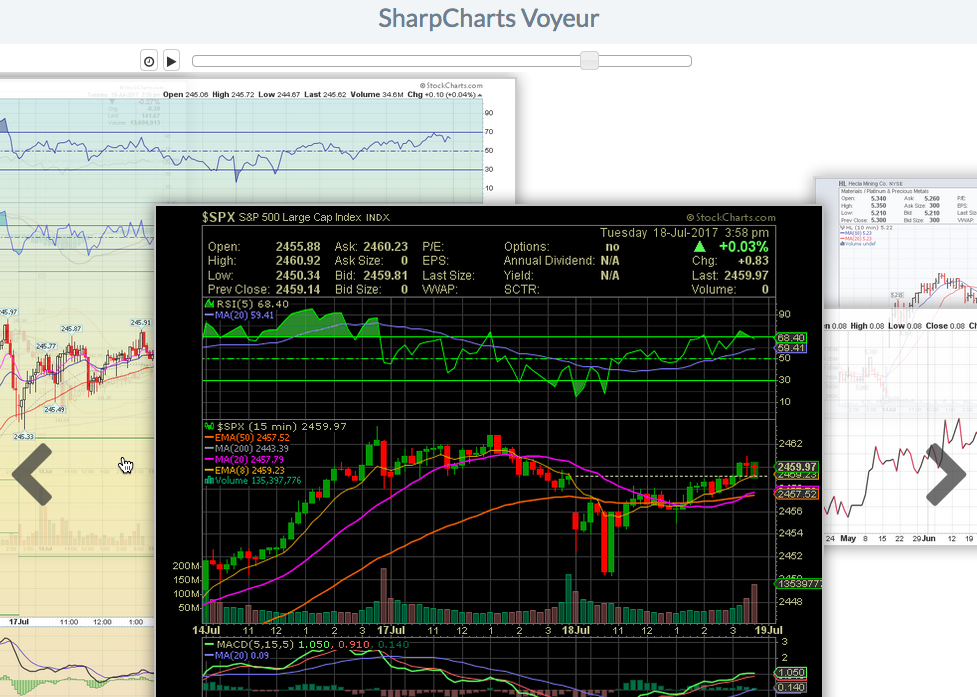
The Voyeur tool shows recently-created charts on a carousel, with the charts rotating at regular intervals. (To protect our users' privacy, charts with text annotations do not appear in SharpCharts Voyeur.)
Using the SharpCharts Voyeur Tool
To pause the carousel, click on either the chart in the center or the Pause button at the top of the screen. Click the Play button to resume the carousel's rotation.
By default, the charts rotate every 3 seconds. To change the speed at which the charts rotate, click on the Clock button at the top of the screen and choose a different interval. You can also cycle through the charts manually by using the left and right arrows at each side of the screen or the slider bar at the top.
Next Up » Educational Resources