Table of Contents
Line Tools
ChartNotes provides you with a wide variety of line-drawing tools. Watch our Line Tools video or read on below to learn more about how to use and apply these utilities.
The Line Tools Menu
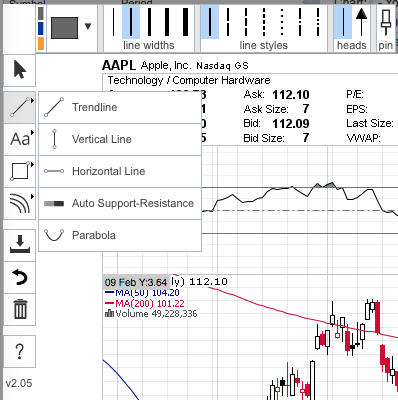
Each of the Line Tools available in ChartNotes is listed and described below in more detail. Here is a screenshot of where you can find the Line Tools menu:
Trend Lines
After selecting the Trendline tool, clicking and dragging on the chart will create a new trend line using the current color/line width/arrowhead settings. For more, please see our ChartSchool article on Trendlines.
Once a trend line is created, it can be selected and modified. To change the line's angle or length, click and drag the yellow squares (“handles”) at either end. To shift the line's position without changing the angle, click on the center of the line and drag. Use the line style boxes located in the horizontal menu at the top of the chart to change the line's color, width and/or arrowhead settings.
Notes:
- For perfectly horizontal or vertical trendlines, hold down the CTRL/CMD key while dragging your mouse to draw the line. When you exit ChartNotes, your trendline will be perfectly horizontal or vertical.
- Press and hold the Shift key and click on the line to toggle an arrowhead on and off.
Horizontal/Vertical Lines
Horizontal Lines can be used to indicate support/resistance areas as well as trading ranges. Vertical Lines can be used to indicate the start/end of significant events or technical signals.
After selecting the Horizontal or Vertical Line tool, clicking on the chart will create a new horizontal or vertical line using the current color/line width settings. Use the line style boxes located in the horizontal menu at the top of the chart to change the line's settings.
Auto Support/Resistance Lines
An Auto Support/Resistance line automatically changes color depending on the location of the price bars. If the price bars are above the line, that part of the line is colored green (support). If the price bars are below the line, that part of the line is colored red (resistance).
After selecting the Auto Support/Resistance Line tool, clicking on the chart will create a new red/green line. Use the line style boxes located in the horizontal menu at the top of the chart to change the line's settings.
Parabolas
After selecting the Parabola tool, you can create a curved line in one of two ways:
- You can click on the chart in three locations, those being the start, the apex and the end of the curved line. The curved line will appear after the third click.
- You can click and drag to draw an approximation of the curved line. When you release your mouse, an updated curved line will replace your drawing.
Use the line style boxes located in the horizontal menu at the top of the chart to change the line's settings.