This is an old revision of the document!
Table of Contents
StockChartsACP
Overview
StockChartsACP (“ACP” stands for “Advanced Charting Platform”) is our newest full-screen, streaming charting tool, built to serve as a comprehensive, interactive technical charting platform with a wide range of dynamic capabilities. More than just a charting workbench - with StockChartsACP, you can have up to nine interactive chart panels on the screen at once, each displaying a different chart.
StockChartsACP allows you to:
- Create advanced technical charts, choosing from dozens of indicators, overlays, display settings and color schemes.
- Display multiple charts on screen at once, using StockChartsACP Layouts.
- Save your charts and settings in your account for on-the-go access.
- Take advantage of StockChartsACP Plugins, which supercharge your StockChartsACP experience with additional chart indicators.
- Trade without leaving StockChartsACP, using our new Tradier integration.
Note: For our long-time SharpCharts fans, rest assured that StockChartsACP will be offered alongside our traditional SharpCharts tool. The two are designed to complement each other. The SharpCharts you've always known and loved aren't going anywhere!
Accessing StockChartsACP
The quickest way to access StockChartsACP is by simply creating a StockChartsACP chart. There are a number of ways to do this:
- Using the “Create a Chart” bar at the top of any of our web pages. First, change the dropdown from “SharpChart” to “ACP”, then enter the ticker symbol you wish to chart and press the “Go” button.
- Clicking on the “ACP” link at the bottom of the SharpCharts Workbench.
- Clicking on the “ACP” icon which is located on most of our report pages, including the Market Summary, Sector Summary, and more.
- Clicking on “Charts & Tools” at the top of any page, then entering a ticker symbol into the “StockChartsACP” section of that page.
- Clicking on the “StockChartsACP” link in the “Member Tools” area of Your Dashboard.
Any of these actions will load a chart for the ticker symbol in StockChartsACP.
Note: For best results, we recommend using StockChartsACP with Chrome or Firefox.
Parts of StockChartsACP
There are several important areas of the StockChartsACP Platform:
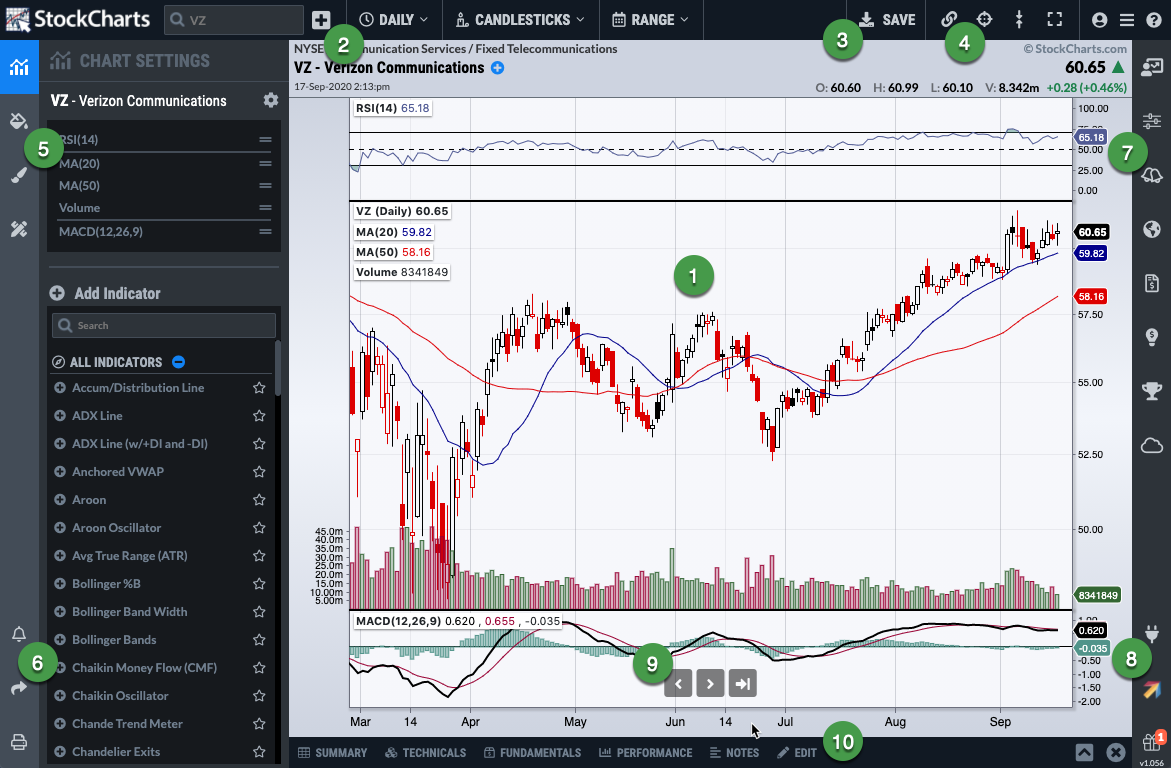
- The Chart Area: display one or multiple StockChartsACP charts.
- The Basic Chart Settings Menu: change the symbol, period, range, and chart type.
- The Save Button: save your charts to StockChartsACP ChartLists for later study.
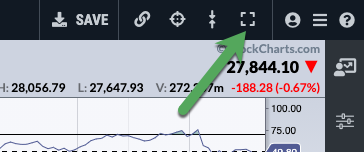
- The Platform Settings Menu: change StockChartsACP settings like full screen, crosshairs, and more.
- The Chart Design Menu: configure chart settings, add indicators, change the color scheme or chart style, and annotate your chart.
- The Chart Actions Menu: share, print, and more.
- The Symbol Selection Menu: find additional symbols to chart from a variety of sources, including your own SharpCharts and StockChartsACP ChartLists.
- The Platform Integrations Menu: extend the functionality of StockChartsACP with plugins and in-line trading functionality.
- The Chart Control Buttons: move back and forth in the chart with fine-grained control.
- The List Drawer: when expanded, this bottom panel allows you to view and edit your StockChartsACP ChartLists.
The use of each of these sections is described below.
Creating a New Chart in StockChartsACP
We've already mentioned several ways to create a new StockChartsACP chart from other places on the StockCharts site, but you can also create a new chart from within StockChartsACP.
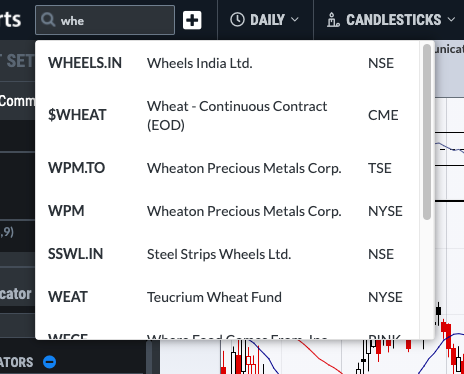
Using the Symbol Box
To change the ticker symbol on the current chart, simply type a new ticker symbol in the “Symbol” box at the top of the page. A dropdown menu will suggest possible symbols. StockChartsACP uses the same data and same ticker symbol conventions as SharpCharts and other StockCharts charting tools. Press Enter to load a chart with your selected ticker symbol.
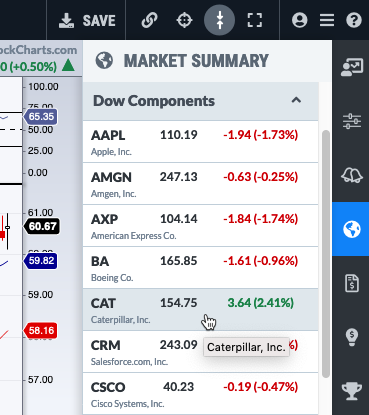
Using the Symbol Selection Menu
You can also use the Symbol Selection menu on the right side of the screen to find additional ticker symbols to chart. This menu provides access not only to your own ChartLists and Alerts, but also to symbols from our standard reports, including the Market Summary, SCTRs, Market Movers lists, Ticker Cloud, and more. Click on a symbol on any of these lists in order to launch a StockChartsACP chart for that symbol.
Adding Multiple Charts with StockChartsACP Layouts
By default, only one chart is displayed in the StockChartsACP tool, but currently, members can display up to 9 charts at once using StockChartsACP Layouts.
Simply click the “plus” icon at the top of the page to add another panel with a second chart. By default, the new chart will use the same symbol as the current chart, but there are a number of ways you can easily add a new panel with a different symbol:
- Type the desired ticker in the “Symbol” box at the top of the chart, then click the “plus” icon.
- Type the desired ticker in the “Symbol” box at the top of the chart, then hold down the Shift key on your keyboard and press the Enter key.
- Hold down the Shift key while clicking on one of the symbols in the Symbol Selection menus on the right.
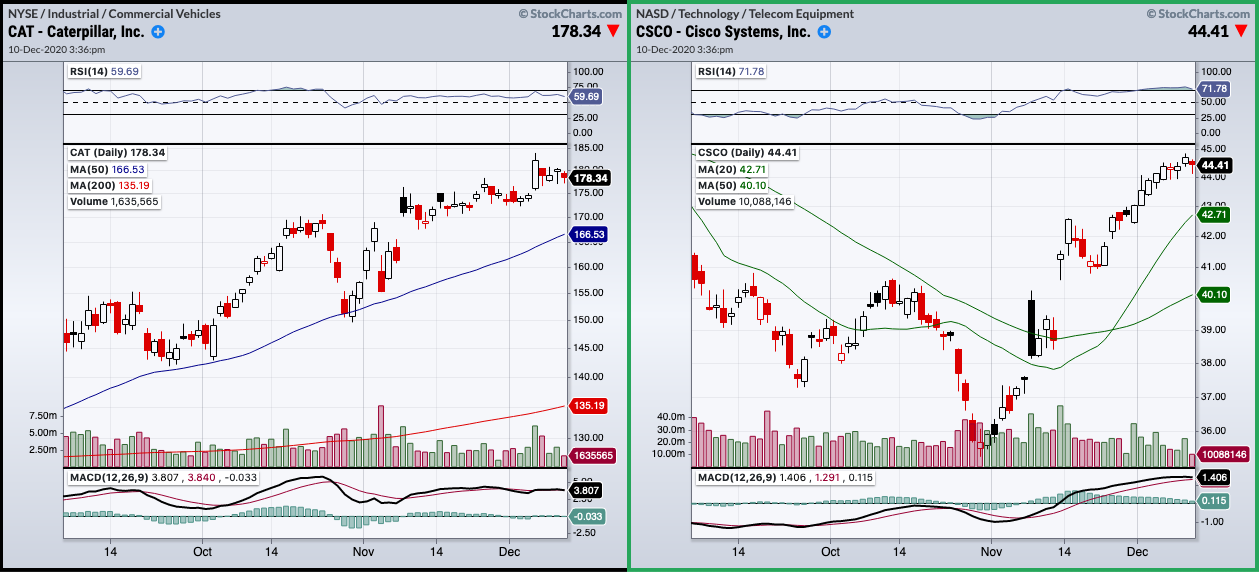
To change the symbol on one of the charts in your StockChartsACP Layout, click on the chart and ensure that there is a blue border around the edge of the chart. Then change the symbol as usual. In the example below, the CSCO chart on the right is the currently-selected one.
Sync Mode
If you have more than one chart in your layout that has the same ticker symbol, Sync Mode allows you to change the symbol for all those charts at once. With this functionality, you could add long-, medium-, and short-term charts for a single symbol to your layout, then quickly change all three charts to a new symbol by entering a new ticker in the Symbol box at the top of the screen.
By default, Sync Mode is disabled and each chart's symbol is updated independently. Click the link icon at the top of the screen to turn on Sync Mode.
Deleting Charts from StockChartsACP Layouts
To delete a chart from your StockChartsACP Layout, mouse over the chart in question, then click on the “X” icon in the upper right corner of the chart.
Note: Only StockCharts members can add chart panels in StockChartsACP. Free users will be limited to a single-chart layout.
Anatomy of a StockChartsACP Chart
All StockChartsACP charts have several common visual elements regardless of their settings. These common elements include:
- The Main Ticker Symbol
- The Chart Header Area
- The Price Plot Area
- The Horizontal Time Axis
- The Primary Vertical Axis
- (Optional) A Secondary Vertical Axis
- (Optional) One or more Technical Overlays
- (Optional) One or more Technical Indicator Panels
The diagram below shows each of these features on a typical StockChartsACP chart:
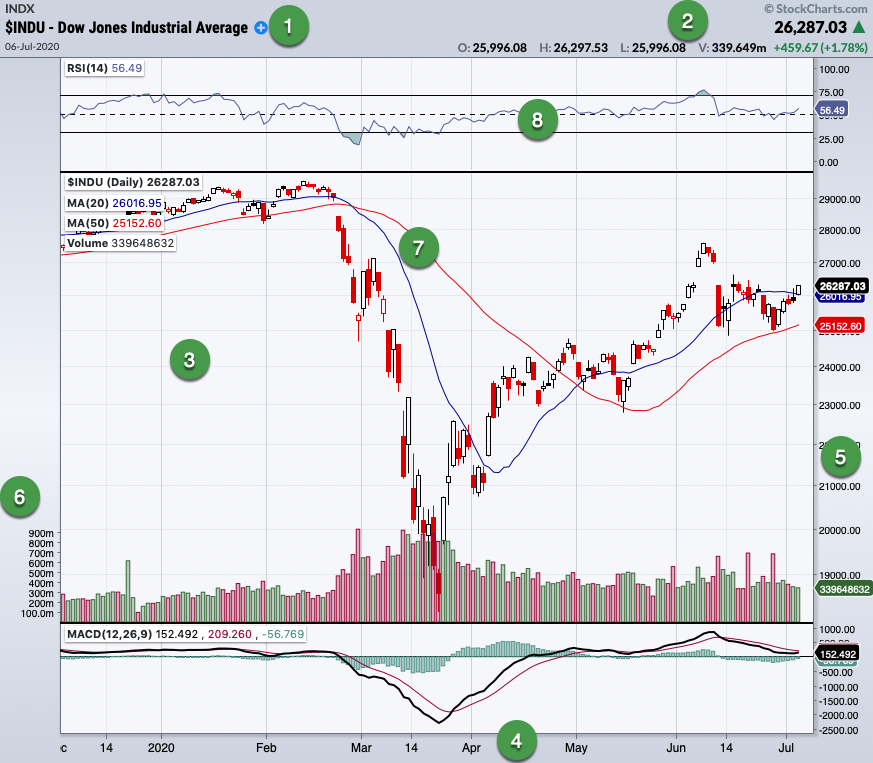
The information displayed in the Chart Header varies depending on the chart configuration but, at a minimum (with the “Slim” chart header configuration), it includes:
- Ticker symbol of the dataset displayed in the Price Plot area
- Date and time of the latest data point (using the time zone of the exchange)
- Closing value of the latest data point
- Change in price since the previous close (see our Percent Change article for more information)
The Standard and Full Quote chart header settings show more detailed information about the symbol. Note that if the chart is very narrow, the Slim header will be shown, regardless of the Chart Header setting chosen.
Viewing Charts in StockChartsACP
There are a number of platform features available to customize your chart-viewing experience on StockChartsACP.
Auto-Refresh
Charts are automatically refreshed during market hours. Charts for logged-in members can refresh every 5 seconds; non-members' charts can refresh every 10 seconds.
Note: Viewing a large number of charts simultaneously may slow down the refresh rate slightly.
Scrolling and Chart Control Buttons
To move backward or forward inside the chart, click and hold the left mouse button while dragging the chart to left or right.
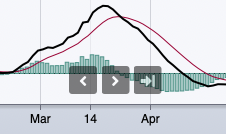
When you mouse over the bottom of the chart panel, you'll see three buttons (the Chart Control buttons) that allow you to move backward and forward on the chart. Use the left and right arrow buttons to scroll forward or backward one bar at a time. Clicking the icon with an arrow and a line will take you back to today's date.
Zooming In/Out
To zoom in on the chart for a more close-up view, use the scroll wheel of your mouse or the standard scrolling gestures on your trackpad/touchscreen. This removes bars from the left side of the chart, allowing the remaining bars to be larger. Scroll in the opposite direction to zoom back out again.
Note: If Fit-to-Window mode is disabled on your chart, you will need to press and hold the Ctrl key while scrolling in order to zoom in or out.
Crosshairs Mode
Similar to SharpCharts Inspector, the crosshairs functionality allows you to see price and indicator values for each bar on the chart. Click the target icon in the Platform Settings menu at the top of the screen to turn on crosshairs mode; then mouse over the date in question. The OHLC values at the top of the screen will change as you mouse over different dates, as will the overlay and indicator values in the chart legend.
 To revert to today's price and indicator values in the legend, simply click the target icon again to turn off Crosshairs Mode.
Fit-to-Window Mode
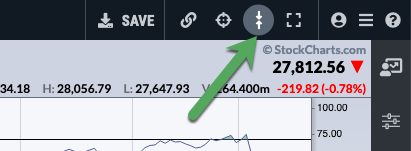
Fit-to-Window mode ensures that your entire chart is visible on the screen at one time, without the need for scrolling. When this mode is disabled, the height of your chart can extend beyond the browser window to give your indicators more vertical space; you can scroll to move the chart up or down in the browser window.
By default, Fit-to-Window mode is enabled. Click the Fit-to-Window icon (the one with two arrows pointing to each other) located in the Platform Settings menu at the top of the screen to disable or enable this mode.
Fullscreen Mode
Clicking the Fullscreen Mode icon in the Platform Settings menu at the top of the screen will expand the StockChartsACP platform to take up the entire screen. Click the icon again to return to the previous browser window size.
Modifying Charts in StockChartsACP
With StockChartsACP, you can customize your charts to meet your particular investing needs. StockCharts offers three main types of customization: editing individual chart settings, using a ChartStyle for quickly configuring a chart, and adding custom annotations to the chart.
Editing StockChartsACP Chart Settings
This section will give you a brief overview of the kinds of customizations you can make to your StockChartsACP charts. Please see our Editing StockChartsACP Charts article in the Support Center for more detailed instructions.
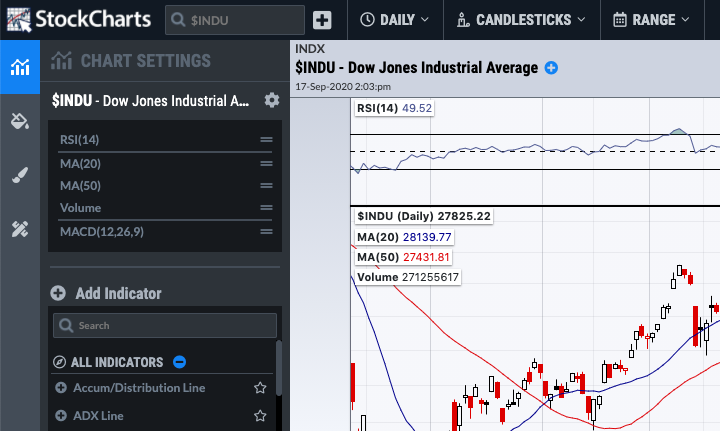
From the Basic Chart Settings menu at the top of the screen, you can change the symbol for the chart, as well as setting the period, range, and chart type.
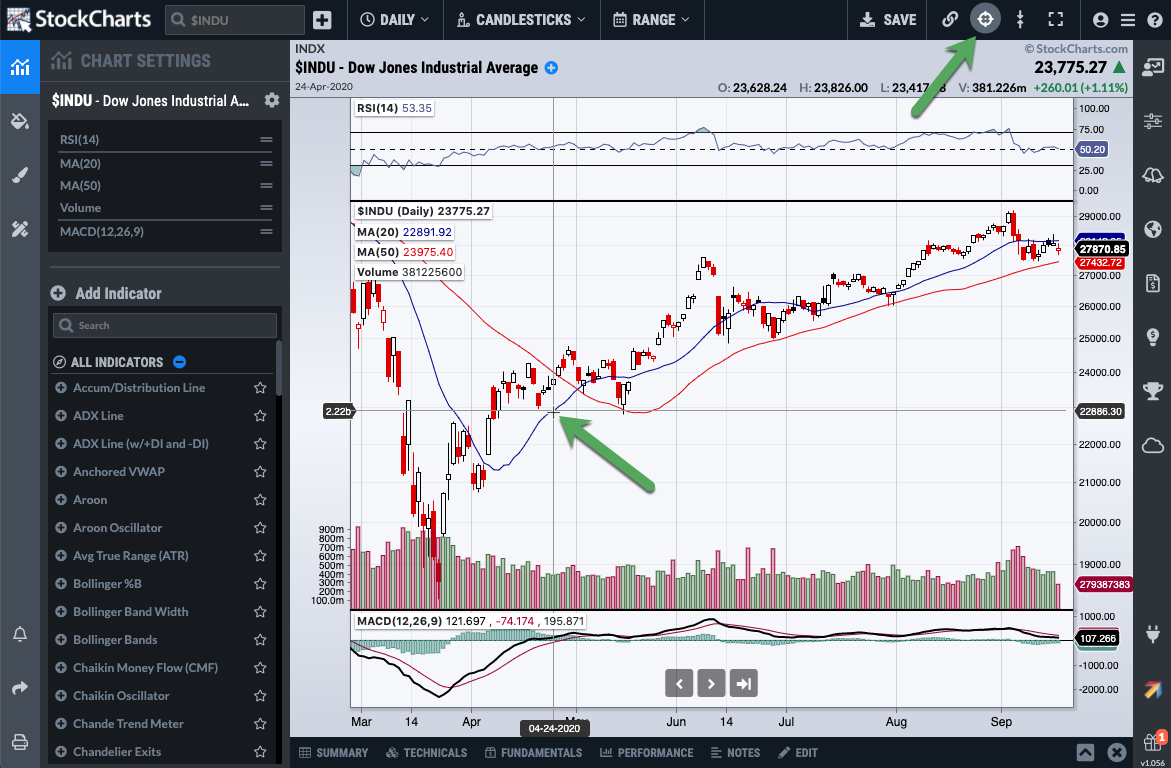
Clicking the Chart Settings icon in the Chart Design menu on the left (as shown above) gives you access to a wealth of other chart settings. In the panel that slides out, you can add and configure indicators and overlays for your chart. Click on the symbol name at the top of this panel to change the chart scale, legend, price and event labels, and more. For quick access to these settings, you can also click on the symbol name or the indicator name in the legend of the chart itself.
Indicator panels can be moved above or below the chart (or added to the main price plot as an overlay) by clicking and dragging on the legend for that indicator panel.
The color scheme of your chart can be changed with a click of a button by accessing the Color Schemes menu. Click the Paint Can icon in the Chart Design menu, then select from dozens of stylish color schemes.
Learn More: Editing StockChartsACP Charts
Using StockChartsACP ChartStyles
If you find yourself using the same chart settings over and over again, then StockChartsACP ChartStyles can help streamline your chart-creation process.
ChartStyles are collections of chart settings that can be used as “templates” for creating new charts or updating existing charts. A ChartStyle specifies the chart's period, date range, chart type, color scheme, overlays, indicators - basically everything except the chart's symbol. Applying a ChartStyle to a chart allows you to quickly configure all those settings with one click.
StockCharts offers several predefined ChartStyles for your use. These styles are useful for different trading strategies, chart timeframes, and trading styles. We also offer the ChartStyles of some of your favorite charting experts.
To apply one of these ChartStyles to your StockChartsACP chart, simply click the Paintbrush icon in the Chart Design menu on the left. Choose your desired ChartStyle from the panel that pops out, and it will be applied to the currently-selected chart.
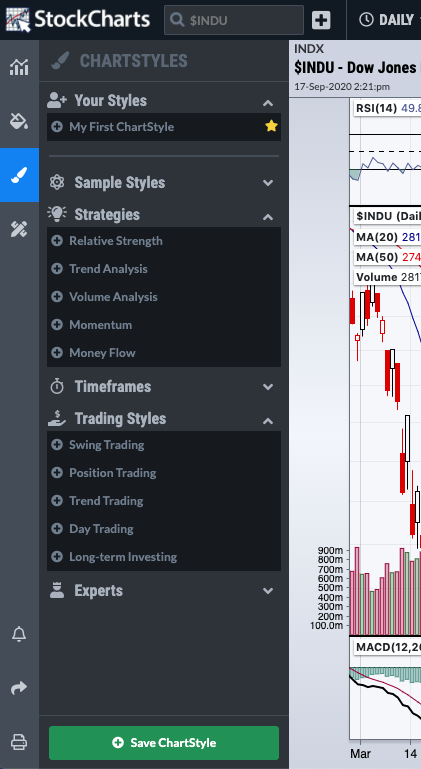
These predefined styles can be used as-is or serve as a starting point for creating your own custom ChartStyles.
To create your own, simply configure a chart with all the desired chart settings, indicators, color schemes, etc., then click the green “Save ChartStyle” button at the bottom of the ChartStyles panel. Your custom ChartStyles will be listed at the top of the panel.
Annotating StockChartsACP Charts
Currently, StockChartsACP offers limited annotation capabilities for your charts, including trendlines, shapes, text, and popular line studies. You can access this functionality from the final icon on the Chart Design menu:
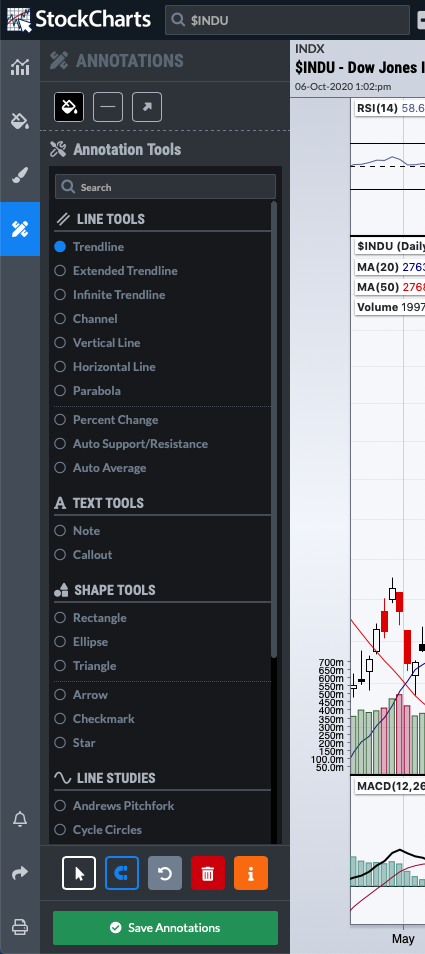
From this menu, you can choose the line color, line width, and the specific annotation you want to draw. For most annotations, simply click and drag on the chart to draw the annotation.
More full-featured annotation functionality will be added soon, including the ability to save annotations directly to a chart.
Saving Charts in StockChartsACP
StockChartsACP charts can be saved into ChartLists - online “folders” that allow members to store up to 500 charts in a single list. ChartLists allow you to group and organize your collections of saved charts for easy access.
Note: Only StockCharts members can use ChartLists. Basic members can have only one ChartList, while Extra members can have up to 250 different ChartLists and Pro members can have 350.
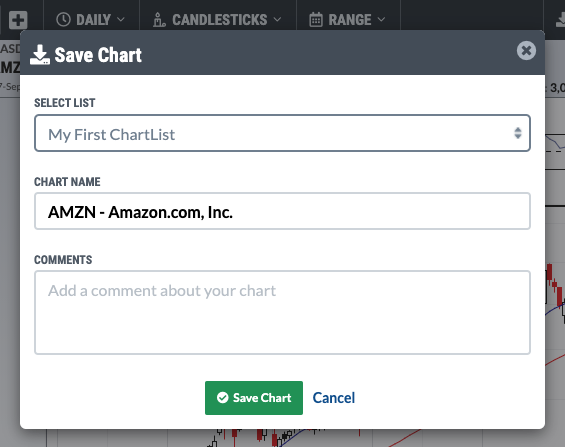
The current chart can be saved to your ChartList by clicking the Save icon (cloud with an up arrow) at the top of your screen. You will be prompted to choose a ChartList and provide a name for the saved chart. Notes about the chart can also be added here.
Viewing Saved Charts
To view a StockChartsACP chart that you have saved to a ChartList, click on the ChartLists icon at the top of the Symbol Selection menu on the right. This will open a panel showing your saved charts. Click on a symbol to launch that saved chart. To see a different ChartList, click the up/down arrow icon next to the ChartList name and select the desired ChartList.
At the bottom of this panel are buttons allowing you to edit the current list or create a new list. A third button opens the List Drawer at the bottom of the screen. From this drawer, you can view more detailed information about the symbols in your ChartList on the Summary tab, view and edit notes about your ChartList on the Notes tab, and edit the symbols on your ChartList on the Edit tab.
For more detailed instructions on saving charts and using ChartLists in StockChartsACP, please see our StockChartsACP ChartLists article in the Support Center.
StockChartsACP Plug-Ins
Our plug-ins allow you to extend the functionality of StockChartsACP, adding specialized indicators to the platform. Both free and paid plug-ins are available, and more are being added all the time.
To add a StockChartsACP plug-in to your account, click the Plug-In Icon on the Platform Integrations menu at the bottom right. A panel will open up showing many of our plug-ins. Click the “Get the Plug-In” button for more information on a specific plugin, or click the “See All Plug-Ins” button at the bottom for a complete list.
Once you've found the plug-in you want to try, click the “Install Now” button (for free plug-ins) or “Buy Now” button (for paid plug-ins). Provide payment information for the paid plug-ins when prompted.
Note: When purchasing plug-ins, be sure to use the same email address that you use for your StockCharts account, so we know which account to install the plug-in on.
A popup window will let you know the plug-in has been successfully installed on your account. It will be available for immediate use when you re-launch StockChartsACP.
Trading from StockChartsACP
StockCharts now offers convenient trading from StockChartsACP through an extension from Tradier. To get started, click the Tradier icon on the Platform Integrations menu at the bottom right. Log in to your Tradier broker account or set up a new account and link it to your StockCharts account.
Then you'll be able to view your portfolio and make trades from within StockChartsACP. Click on the Tradier icon to see a summary of accounts in the panel on the right. For details, click the “Open Trading Drawer” button at the bottom of the panel.
For assistance with setting up a Tradier brokerage account or making trades, please contact Tradier support directly.