Table of Contents
StockChartsACP Line Study Tools
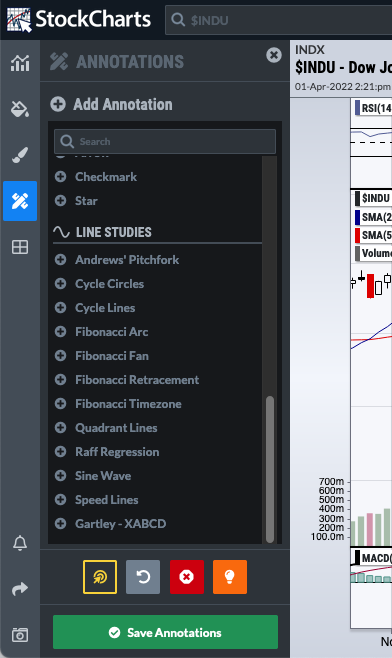
StockChartsACP provides you with a wide variety of popular Line Study drawing tools for your charts. Each of the Line Study Tools available in StockChartsACP is listed and described below in more detail. These tools can be found by clicking on the Annotations (pencil and ruler) icon in the Chart Design menu and then looking for the Line Studies section.
Andrews' Pitchforks
Andrews' Pitchfork lines can help you anticipate where reversals may occur in the future. Select three consecutive significant reversals, and the Andrews' Pitchfork annotation will be drawn automatically. For more information, please see our ChartSchool article on Andrews' Pitchforks.
After selecting the Andrews' Pitchfork tool, click on a significant bottom (or top) on your chart, then click on the next important reversal and, lastly, click again on the next important reversal beyond that. Once the annotation has been added, it can be selected and modified. To adjust the location of any of the reversals, click on the corresponding circle handle and drag to the new reversal location. To reposition the entire annotation without changing its shape, click on one of the lines (away from the handles) and drag to the new position.
Use the Edit Annotation panel to change the annotation's color, opacity, line thickness, and line style.
Cycle Circles
Cycle Circles can be used for studying cycles on your charts. Set the starting and ending point for one cycle, and the other cycles will automatically be added to the chart. For more information, please review our ChartSchool article on Cycles.
After selecting the Cycle Circles tool, click at the start of a cycle and drag to the end of that cycle on the chart. The further you drag, the longer the cycle. Once the annotation has been created, it can be selected and modified. To change the length of the cycle, click on one of the circle handles and drag to the desired cycle length. To reposition the annotation without changing the cycle length, click on the line (away from the handles) and drag to the new position.
Use the Edit Annotation panel to change the annotation's color, opacity, line thickness, and line style.
Cycle Lines
Cycle Lines can be used for studying cycles on your charts. Set the starting and ending point for one cycle, and the other cycles will automatically be added to the chart. For more information, please review our ChartSchool article on Cycles.
After selecting the Cycle Lines tool, click at the start of a cycle and drag to the end of that cycle on the chart. The further you drag, the longer the cycle. Once the annotation has been created, it can be selected and modified. To change the length of the cycle, click on one of the circle handles and drag to the desired cycle length. To reposition the annotation without changing the cycle length, click on the line (away from the handles) and drag to the new position.
Use the Edit Annotation panel to change the annotation's color, opacity, line thickness, and line style. Checking the “Display All Values” checkbox will display the number of bars per cycle at the bottom of the annotation, even when the annotation is not selected.
Keyboard Shortcuts:
- To toggle the display of the number of bars, hold down the SHIFT key and then click on the annotation.
Fibonacci Arcs
Fibonacci Arcs are used to identify potential support, resistance, or reversal points. Place this line study between a significant top and bottom on the chart, and important Fibonacci Retracement levels (23.6%, 38.2%, 50%, and 61.8%) will be added to the chart in an arc radiating from the second point. For more information, please see our ChartSchool article on Fibonacci Arcs.
After selecting the Fibonacci Arc tool, click on a significant bottom (or top) on your chart and the drag up (or down) and to the right to the next significant top (or bottom). Once the Fibonacci Arc has been created, it can be selected and modified. To change the location of the top or bottom, click on the circle (“handle”) associated with that top or bottom and drag it to a new location. To reposition the annotation without changing its size, click on the base line (the line between the two handles) and drag it to the new position.
Use the Edit Annotation panel to change the annotation's color, opacity, line thickness, and line style. Change the background fill by clicking the checkbox next to the Fill color, then selecting the desired fill color and opacity. By default, the annotation displays four important Fibonacci levels (23.6%, 38.2%, 50%, and 61.8%), but additional Fibonacci levels can be added by clicking the corresponding checkboxes in the Edit Annotation panel.
Keyboard Shortcuts:
- To toggle between showing all available Fibonacci levels and just the default ones, hold down the SHIFT+CTRL key (SHIFT+CMD on a Mac) and then click on the annotation.
- To quickly toggle fill mode for the Fibonacci arc, click CTRL+F (CMD+F on a Mac) while the annotation is selected.
Fibonacci Fans
Fibonacci Fans are used to identify potential support, resistance, or reversal points. Place this line study between a significant top and bottom on the chart and fan lines passing through important Fibonacci Retracement levels (23.6%, 38.2%, 50%, and 61.8%) at the time of the second data point will be added to the chart. For more information, please see our ChartSchool article on Fibonacci Fans.
After selecting the Fibonacci Fan tool, click on a significant bottom (or top) on the chart and then drag up (or down) to the next significant top (or bottom). Once the annotation has been added, it can be selected and modified. To change the location of the top or bottom, click on the circle handle associated with that top or bottom and drag it to a new location.
Use the Edit Annotation panel to change the annotation's color, opacity, line thickness, and line style. Change the background fill by clicking the checkbox next to the Fill color, then selecting the desired fill color and opacity. By default, the annotation displays four important Fibonacci levels (23.6%, 38.2%, 50%, and 61.8%), but additional Fibonacci levels can be added by clicking the corresponding checkboxes in the Edit Annotation panel.
Keyboard Shortcuts:
- To toggle between showing all available Fibonacci levels and just the default ones, hold down the SHIFT+CTRL key (SHIFT+CMD on a Mac) and then click on the annotation.
- To quickly toggle fill mode for the Fibonacci fan, click CTRL+F (CMD+F on a Mac) while the annotation is selected.
Fibonacci Retracement Lines
Fibonacci Retracement lines can help you anticipate where reversals may occur in the future. Place this line study between a significant top and significant bottom, and important Fibonacci Retracement levels (0%, 23.6%, 38.2%, 50%, 61.8%, 78.6%, 100%, 138.2%, and 161.8%) will automatically be added to the chart, with their values displayed on each line. For more information, please see our ChartSchool article on Fibonacci Retracements.
After selecting the Fibonacci Retracement tool, click on a significant bottom (or top) on your chart and then drag up (or down) and to the right to the next significant top (or bottom). Once the Fibonacci Retracements annotation has been created, it can be selected and modified. To change the location of the top or bottom, click on the circle (“handle”) associated with that top or bottom and drag it to a new location. To reposition the annotation without changing its size, click on the top or bottom bar and drag to the new position.
Use the Edit Annotation panel to change the annotation's color, opacity, line thickness, and line style. Change the background fill by clicking the checkbox next to the Fill color, then selecting the desired fill color and opacity. Checking the “Display All Values” checkbox will display the price at each retracement level. By default, the annotation displays nine important Fibonacci levels, but additional Fibonacci levels can be added by clicking the corresponding checkboxes in the Edit Annotation panel.
Keyboard Shortcuts:
- To toggle between showing all available Fibonacci levels and just the default ones, hold down the SHIFT+CTRL key (SHIFT+CMD on a Mac) and then click on the annotation.
- To toggle display of the price on each level, hold down the SHIFT key and then click on the annotation.
- To quickly toggle fill mode for the Fibonacci retracement annotation, click CTRL+F (CMD+F on a Mac) while the annotation is selected.
Fibonacci Time Zones
Fibonacci Time Zone lines can help you anticipate when significant price changes may occur in the future. Click on the starting point of the timeframe you'd like to study, and the Fibonacci Time Zone lines will be added to your chart. For more information, please see our ChartSchool article on Fibonacci Time Zone lines.
After selecting the Fibonacci Time Zone Lines tool, click on the chart to determine the starting point for the Time Zones. Note that the spacing of the subsequent lines is fixed and cannot be changed. To reposition the starting point after the annotation has been created, click on the starting line and drag it to the new location.
Use the Edit Annotation panel to change the annotation's color, opacity, line thickness, and line style.
Quadrant Lines
Quadrant Lines can help you anticipate where reversals may occur in the future. Draw the line study from the beginning to the end of the timeframe you'd like to analyze, and important quadrant levels for that time period will be automatically added to the chart. For more information, please see our ChartSchool article on Quadrant Lines.
After selecting the Quadrant Lines tool, click your mouse at the start of the period you wish to analyze and then drag to the right until reaching the end of the period you wish to analyze. The annotation will be automatically resized to encompass all the bars during that time period. Once the Quadrant Lines annotation has been created, it can be selected and modified. To change the location of the start or end of the timeframe, click on the circle (“handle”) at the left or right side of the annotation and drag to a new starting or ending bar. To reposition the annotation while keeping the length of the timeframe the same, click on the center line and drag to the new position.
Use the Edit Annotation panel to change the annotation's color, opacity, line thickness, and line style. Change the background fill by clicking the checkbox next to the Fill color, then selecting the desired fill color and opacity.
Keyboard Shortcuts:
- To quickly toggle fill mode for the Quadrant Lines annotation, click CTRL+F (CMD+F on a Mac) while the annotation is selected.
Raff Regression Channels
Raff Regression Channels can show the overall trend for prices during a given period of time, along with expected upper and lower bounds for price movements. Set the starting point of the timeframe you'd like to study, and the Raff Regression Channel lines will be added to the chart. The channel width will depend on the range of price data during the timeframe covered by the channel. For more information, please see our ChartSchool article on Raff Regression Channels.
After selecting the Raff Regression Channel tool, click your mouse at the start of the period you wish to analyze, then drag to the right until you have enough data points to create a useful channel. Once the annotation has been added, it can be selected and modified. To change the length of the channel, click on one of the circle handles at either end of the channel and drag it to the desired length. To reposition the channel without changing the length, click and drag the center line of the channel to the new position.
Use the Edit Annotation panel to change the annotation's color, opacity, line thickness, and line style. Change the background fill by clicking the checkbox next to the Fill color, then selecting the desired fill color and opacity.
Keyboard Shortcuts:
- To quickly toggle fill mode for the channels, click CTRL+F (CMD+F on a Mac) while the annotation is selected.
Sine Waves
Sine Waves can be used for studying cycles on your charts. Set the starting and ending point for one cycle, and the other cycles will automatically be added to the chart. For more information, please review our ChartSchool article on Cycles.
After selecting the Sine Waves tool, click at the start of a cycle and drag vertically to set the height of the wave, then horizontally to set the length of the cycle.
Once the annotation has been created, it can be selected and modified. To change the length of the cycle and/or the height of the sine wave, click on one of the circle handles and drag to the desired cycle length and/or wave height. To reposition the annotation without changing the length or height, click on the line (away from the handles) and drag to the new position.
Use the Edit Annotation panel to change the annotation's color, opacity, and line thickness.
Speed Resistance Lines
Speed Resistance Lines can help you anticipate significant price changes in the future. Place this line study between a significant top and bottom on the chart and 1/3 and 2/3 retracement level lines will be added to the chart. For more information, please see our ChartSchool article on Speed Resistance Lines.
After selecting the Speed Resistance Lines tool, click on a significant reversal point on the chart and drag towards the next price reversal point. Once the annotation has been created, it can be selected and modified. To change the location of the top or bottom, click on the circle handle associated with that top or bottom and drag it to a new location.
Use the Edit Annotation panel to change the annotation's color, opacity, line thickness, and line style. Change the background fill by clicking the checkbox next to the Fill color, then selecting the desired fill color and opacity.
Keyboard Shortcuts:
- To quickly toggle fill mode for the annotation, click CTRL+F (CMD+F on a Mac) while the annotation is selected.
XABCD (Gartley/Harmonic Patterns)
The XABCD tool helps you annotate harmonic patterns on your charts by selecting five consecutive significant reversals on your chart. For more information about these patterns, please see our ChartSchool article on Harmonic Patterns.
After selecting the XABCD tool, click on a significant top (or bottom) on your chart, then click on the next important reversal, then the next important reversal after that, and so on. Once you have made five clicks (bottom-top-bottom-top-bottom or top-bottom-top-bottom-top), the Harmonic Patterns lines will be drawn on your chart.
Once the annotation has been created, it can be selected and modified. Click and drag on any of the lines to reposition the entire annotation. To make adjustments to any of the five points, click and drag on the corresponding circle handle.
Use the Edit Annotation panel to change the annotation's color, opacity, and line thickness. Change the background fill by clicking the checkbox next to the Fill color, then selecting the desired fill color and opacity.
Keyboard Shortcuts:
- To quickly toggle fill mode for the annotation, click CTRL+F (CMD+F on a Mac) while the annotation is selected.