Table of Contents
StockChartsACP Shape Tools
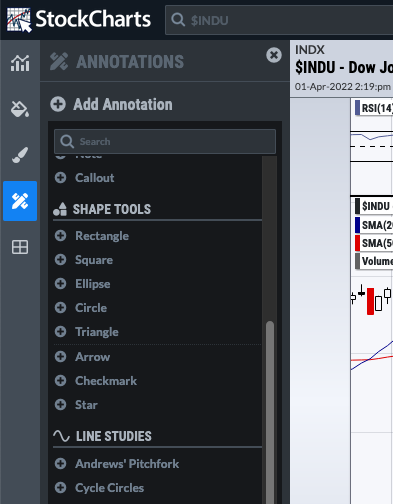
StockChartsACP allows you to create shapes and filled regions on your chart using a number of different shape-drawing tools. Each of the Shape Tools available in StockChartsACP is listed and described below in more detail. These tools can be found by clicking on the Annotations (pencil and ruler) icon in the Chart Design menu and then looking for the ShapeTools section.
Rectangles and Squares
The Rectangle tool can be used to create hollow, shaded (semi-transparent) or filled rectangular regions on your chart. After selecting the Rectangle tool, click and drag your mouse to create the rectangle. Once the rectangle has been created, it can be selected and modified. To change the height or width of the rectangle, click and drag the circles (“handles”) at the corners of the rectangle. To change the rectangle's position without changing the shape, click and drag on one of the sides of the rectangle (away from the handles).
Use the Edit Annotation panel to change the rectangle's color, opacity, line thickness, line style, and corner style (regular or rounded). Change the background fill of the rectangle by clicking the checkbox next to the Fill color, then selecting the desired fill color and opacity.
You can make the rectangle a perfect square by clicking the Perfect Square checkbox and then clicking on one of the handles. The annotation's height will be adjusted to make it a perfect square.
If you know you always want it to be a square, you can also use the Square annotation tool. The instructions for configuring Square annotations are the same as for the Rectangle tool.
Keyboard Shortcuts:
- To adjust an existing rectangle to be a perfect square, hold down the Shift key while clicking and dragging on one of the handles. Note that this does not lock the annotation into the square shape like the Perfect Square checkbox does.
- To quickly toggle fill mode for a rectangle or square, click CTRL+F (CMD+F on a Mac) while the rectangle or square is selected.
Ellipses and Circles
The Ellipse tool can be used to create hollow, shaded (semi-transparent) or filled oval or circular regions on your chart. After selecting the Ellipse tool, click and drag your mouse to create the ellipse. Once the ellipse has been created, it can be selected and modified. To change the height and width of the ellipse, click and drag the circle (“handle”) near the lower right edge of the annotation. To reposition the ellipse on the chart without changing its shape, click and drag on the edge of the ellipse.
Use the Edit Annotation panel to change the ellipse's color, opacity, line thickness, and line style. Change the background fill of the ellipse by clicking the checkbox next to the Fill color, then selecting the desired fill color and opacity.
You can make the ellipse a perfect circle by clicking the Perfect Circle checkbox and then clicking on the annotation's handle. The annotation's height will be adjusted to make it a perfect circle.
If you know you always want it to be a circle, you can also use the Circle annotation tool. The instructions for configuring Circle annotations are the same as for the Ellipse tool.
Keyboard Shortcuts:
- To adjust an existing ellipse to be a perfect circle, hold down the Shift key while clicking and dragging on its handle. Note that this does not lock the annotation into the circle shape like the Perfect Circle checkbox does.
- To quickly toggle fill mode for an ellipse or circle, click CTRL+F (CMD+F on a Mac) while the ellipse or circle is selected.
Triangles
The Triangle tool can be used to create hollow, shaded (semi-transparent) or filled triangular regions on your chart. After selecting the Triangle tool, click three times on the chart - one for each corner of the triangle. Once the triangle has been created, it can be selected and modified. To change the shape of the triangle, click and drag on one of the circles (“handles”) at the three points of the triangle. To reposition the triangle without changing its shape, click and drag on one of the sides of the triangle (away from the handles).
Use the Edit Annotation panel to change the triangle's color, opacity, line thickness, and line style. Change the background fill of the triangle by clicking the checkbox next to the Fill color, then selecting the desired fill color and opacity.
Keyboard Shortcuts:
- To quickly toggle fill mode for a triangle, click CTRL+F (CMD+F on a Mac) while the triangle is selected.
Arrows
The Arrow tool can be used to add small arrow shapes to a chart. These are useful for indicating where signals or significant events occur on your chart. After selecting the Arrow tool, click on the chart in the area where you want to place the head of the arrow, then drag in the direction you want the tail to be. The arrow will appear as you drag your mouse.
The handles for the Arrow annotation are different from many other annotations. Each Arrow has three handles. Use the handle with two diagonal arrows to change the height and width of the annotation. Use the handle with vertical and horizontal arrows to reposition the annotation without changing its shape. Use the handle with the circular arrow to rotate the annotation.
Use the Edit Annotation panel to change the arrow's color, opacity, and line thickness. Change the background fill of the arrow by clicking the checkbox next to the Fill color, then selecting the desired fill color and opacity.
Keyboard Shortcuts:
- To quickly toggle fill mode for an arrow, click CTRL+F (CMD+F on a Mac) while the arrow is selected.
Checkmarks
The Checkmark tool can be used to add small checkmark shapes to a chart. After selecting the Checkmark tool, click on the chart in the area where you want to place the center of the checkmark, then drag to the right and down to create a checkmark of the desired size.
The handles for the Checkmark annotation are different from many other annotations. Each Checkmark annotation has three handles. Use the handle with two diagonal arrows to change the height and width of the annotation. Use the handle with vertical and horizontal arrows to reposition the annotation without changing its shape. Use the handle with the circular arrow to rotate the annotation.
Use the Edit Annotation panel to change the checkmark's color, opacity, and line thickness. Change the background fill of the checkmark by clicking the checkbox next to the Fill color, then selecting the desired fill color and opacity.
Keyboard Shortcuts:
- To quickly toggle fill mode for a checkmark, click CTRL+F (CMD+F on a Mac) while the checkmark is selected.
Stars
The Star tool can be used to add small star shapes to a chart. After selecting the Star tool, click on the chart in the area where you want to place the center of the star, then drag to the right and down to create a star of the desired size.
The handles for the Star annotation are different from many other shapes. Each Star annotation has three handles. Use the handle with two diagonal arrows to change the height and width of the annotation. Use the handle with vertical and horizontal arrows to reposition the annotation without changing its shape. Use the handle with the circular arrow to rotate the annotation.
Use the Edit Annotation panel to change the star's color, opacity, and line thickness. Change the background fill of the star by clicking the checkbox next to the Fill color, then selecting the desired fill color and opacity.
Keyboard Shortcuts:
- To quickly toggle fill mode for a star, click CTRL+F (CMD+F on a Mac) while the star is selected.