Table of Contents
StockChartsACP Layouts
Overview
By default, only one chart is displayed in the StockChartsACP tool, but currently, members can display up to 12 charts at once using StockChartsACP Layouts.
Additional charts can be added to the layout one at a time, or you can choose a preconfigured layout to quickly add multiple charts at once. Each chart can be updated independently, or you can use Multi-Chart Settings to update multiple charts at the same time.
In addition to providing the tools to build custom layouts, StockCharts also offers sample layouts designed for a specific purpose (e.g. GalleryView-style layouts, Intermarket Analysis layouts, etc.). These sample layouts can be used as-is, or used as a starting point for creating a custom layout.
Members can save their custom-configured layout and reapply it to a new set of charts at a later time.
Note: Only StockCharts members can add chart panels in StockChartsACP. Free users will be limited to a single-chart layout.
Saving With Or Without Symbols
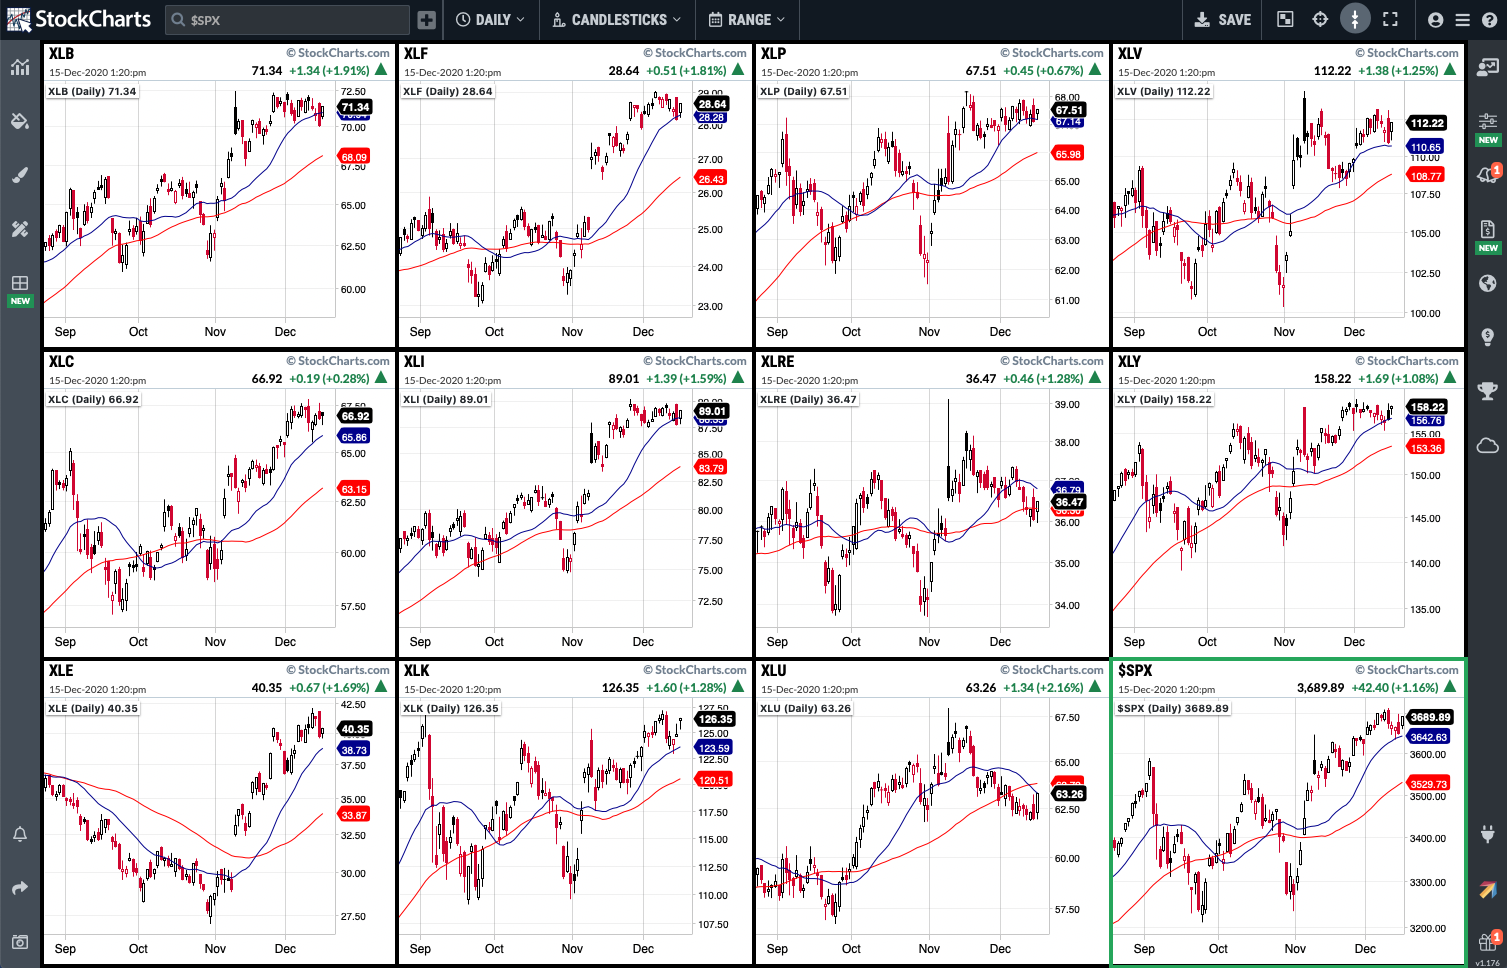
In general, saved layouts include everything but the symbols: they define the number of charts and their placement within the layout, as well as the style settings for each chart. For example, the CandleGlance sample layout allows you to create a layout with 12 small charts, configured similarly to our default CandleGlance view for SharpCharts. The GalleryView sample layout is designed to show intraday, daily, weekly, and monthly charts at a glance for a single symbol, similar to GalleryView for SharpCharts.
Saved layouts can also be configured to save the symbols along with the layout settings. Some of our sample layouts, listed under Predefined Groups in the Layouts panel, include symbols that are frequently used with that layout. For example, the US Sector ETFs sample layout includes the symbols for SPY and the 11 sector ETFs. When you apply this sample layout, a multi-chart layout will be loaded with charts for those specific symbols.
Members' custom-configured layouts can also be saved either with or without the symbols. When you apply a saved layout that has been saved with symbols, then the symbols on the current charts will be replaced with the symbols that were saved in the layout.
Accessing the Layouts Panel
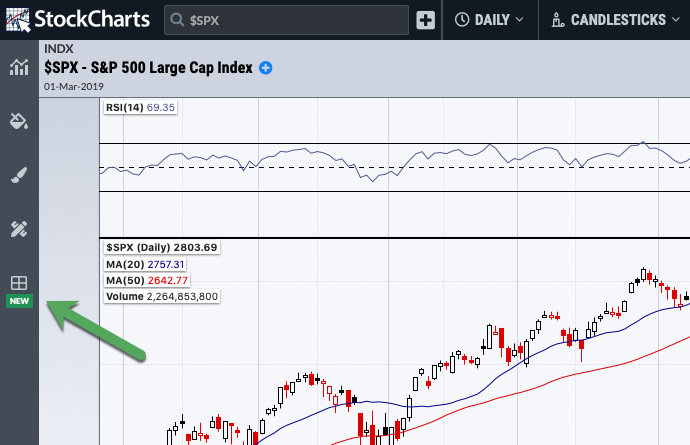
To quickly create a multi-chart layout in StockChartsACP, click the Grid icon in the Chart Design menu on the left.
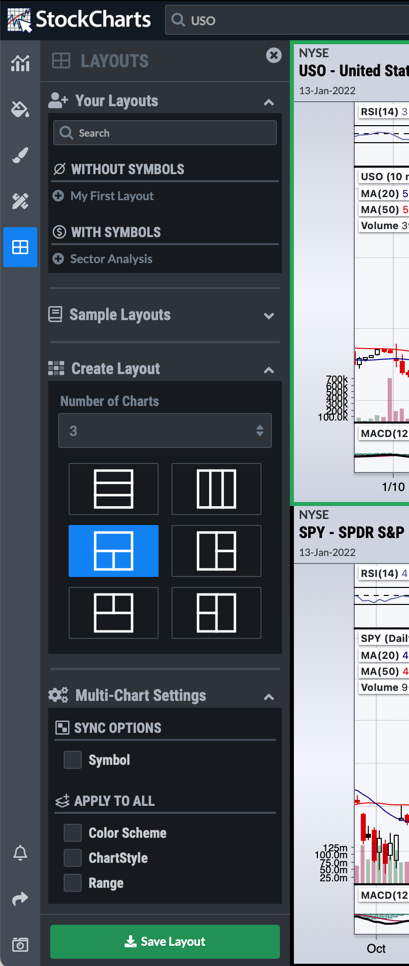
This opens the Layout Panel, which includes four sections:
- Your Layouts lists any custom layouts you have saved to your account.
- Sample Layouts allows you to apply pre-configured layouts designed by StockCharts.
- Create Layout is used to quickly build a layout from scratch, by specifying the number of charts to add and their placement within the layout.
- Multi-Chart Settings contains tools that allow you to make the same change on more than one chart at the same time.
Applying an Existing Layout
It's quite simple to apply an existing layout, whether a sample layout or a custom layout you have saved. Just go to the Layouts panel and click on the layout you want to use.
However, it is important to understand what will happen to the existing charts you have open in StockChartsACP when you apply that layout. Charts on your screen may be deleted in order to match the number of charts specified in the new layout.
Let's look at a few different scenarios.
- Layout has same number of charts: If the layout you apply contains the same number of charts as you have open on the screen, then the layout will display charts for the symbols already shown on your screen. For example, if you have 3 charts on the screen and you apply a 3-chart layout, the symbols of your on-screen charts will be used in the new layout.
- Layout contains more charts: If the layout you apply contains more charts than you have open on the screen, then any additional charts will be loaded using the symbol of the currently-selected chart (outlined in green). For example, if you have 3 charts on your screen and the second one (a chart of XLK) is selected, then you apply a 4-chart layout, the new layout will use the symbols of the 3 on-screen charts, plus add one more chart of XLK for the fourth chart in the new layout.
- Layout contains fewer charts: If the layout you apply contains fewer charts than you have, then the extraneous charts will be deleted. For example, if you have 5 charts on the screen and you apply a 3-chart layout, the symbols of the first three charts on the screen will be used for the new layout and the final two charts on the screen will be deleted.
- Layout was saved with symbols: In all three of the scenarios above, if you apply a saved layout that was saved with the symbols, then the symbols in the charts on your screen will be replaced with the symbols that are defined as part of the layout.
- Layout is a Predefined Group layout: If you apply a predefined group layout, any charts on the screen are completely replaced with the symbols that are defined as part of the layout. For example, if you have a variety of market breadth charts on your screen and you click the US Sector ETFs layout, your market breadth charts will be deleted and new charts will be added for SPY and the eleven sector ETFs.
Note: Charts that are deleted as part of applying a layout are deleted immediately and cannot be recovered. Be sure any on-screen charts you may want to use later have been saved to a ChartList before applying a new layout.
Creating a New Custom Layout
Members are not limited to the sample layouts provided by StockCharts; you have tools at your disposal to create your own unique custom layouts.
To quickly create a multi-chart layout, go to the Layouts panel and find the Create Layout section of the panel. Choose the number of charts you'd like in your Layout (up to a maximum of 12). You will be shown different options for how that number of charts can be arranged. Choose the arrangement you prefer, and the layout will be created on your screen:
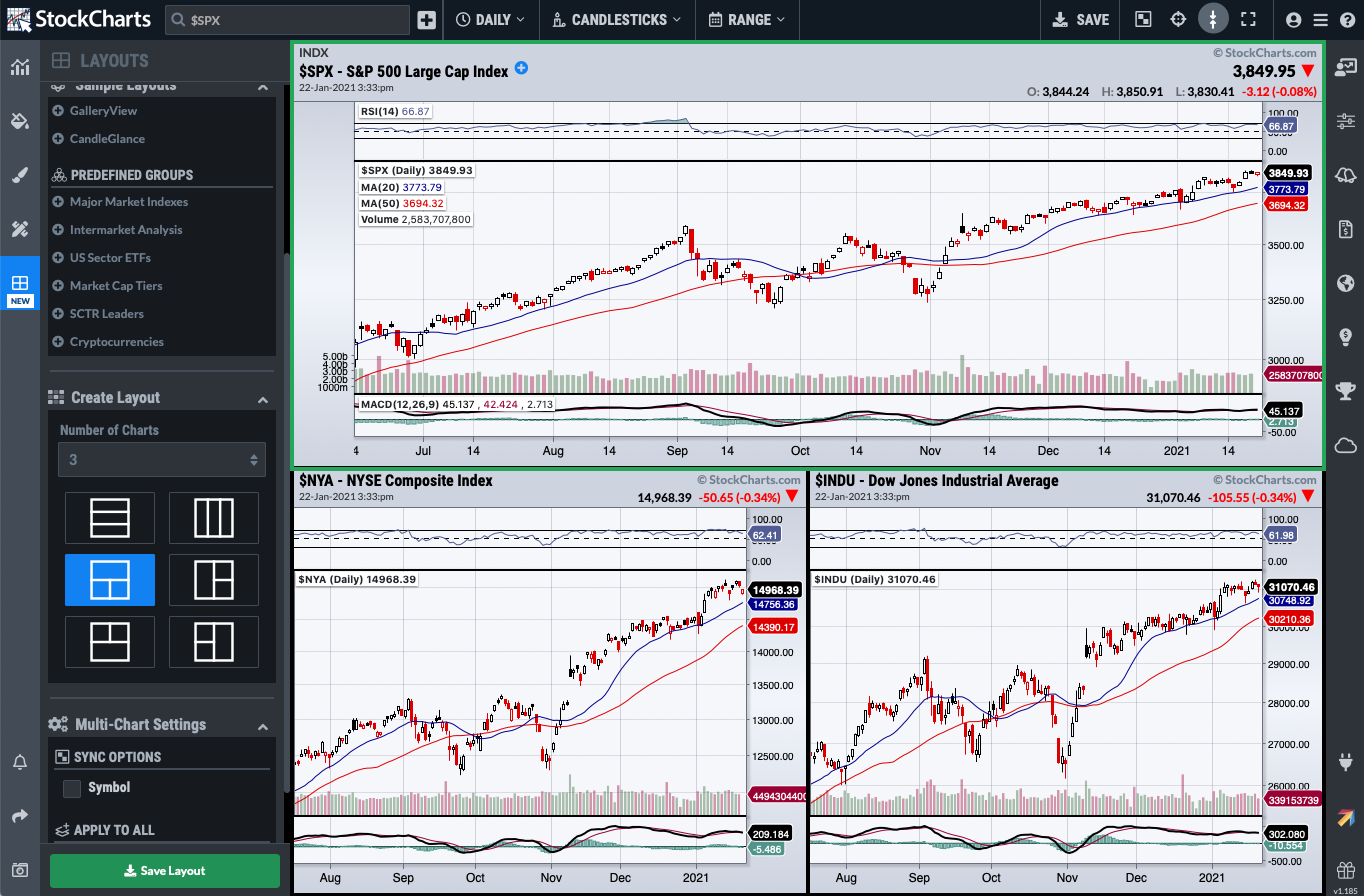
Once created, these new charts can be edited just like any other StockChartsACP chart.
Note: If you select a number of charts smaller than the number of charts in the layout currently on your screen, the extraneous charts on the screen will be deleted. Please see Applying an Existing Layout for example scenarios and more information on which charts will be deleted.
Modifying a Chart in a Layout
Adding Charts to StockChartsACP Layouts
Charts can also be added to your layout one at a time, rather than choosing the number of charts up front.
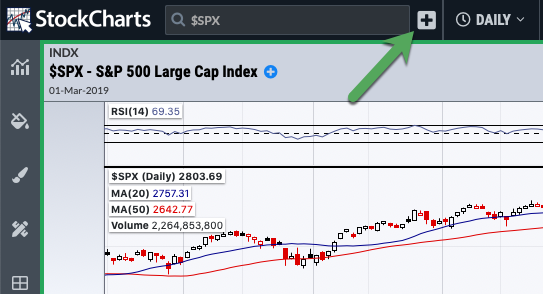
Simply click the “plus” icon at the top of the page to add another chart to your layout, up to a maximum of 12 charts. By default, the new chart will use the same symbol as the currently-selected chart, but the new chart can be easily edited to change the symbol.
There are also a number of ways you can add a new chart to your layout with a specific symbol:
- Type the desired ticker in the “Symbol” box at the top of the chart, then click the “plus” icon.
- Type the desired ticker in the “Symbol” box at the top of the chart, then hold down the Shift key on your keyboard and press the Enter key.
- Hold down the Shift key while clicking on one of the symbols in the Symbol Selection menus on the right.
Deleting Charts from StockChartsACP Layouts
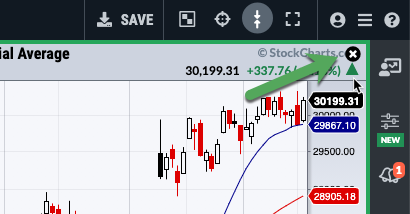
To delete a chart from your StockChartsACP Layout, mouse over the chart in question, then click on the “X” icon in the upper right corner of the chart.
Editing Charts in a StockChartsACP Layout
Changing the symbol (or editing any other chart settings) for one of the charts in your layout is exactly the same as editing a standalone StockChartsACP chart.
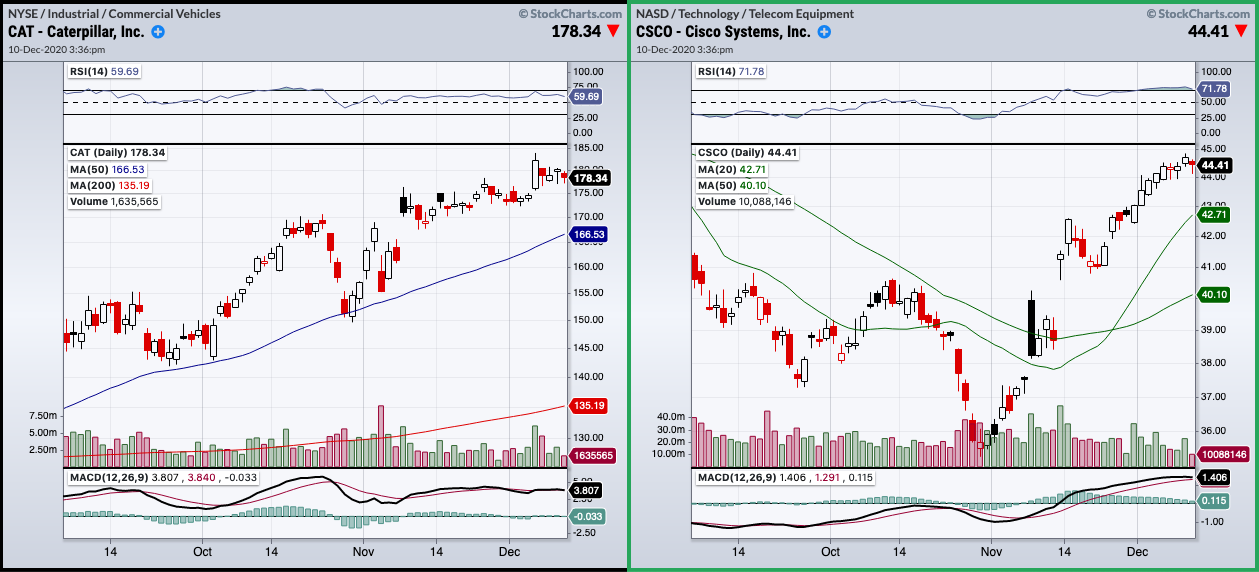
To change the symbol on one of the charts in your StockChartsACP Layout, click on the chart and ensure that there is a green border around the edge of the chart. Then change the symbol as usual. In the example below, the CSCO chart on the right is the currently-selected one.

Modifying Multiple Charts in a Layout
The Multi-Chart Settings section of the Layout Panel allows you to make changes to several charts in the layout at once.
Sync Options
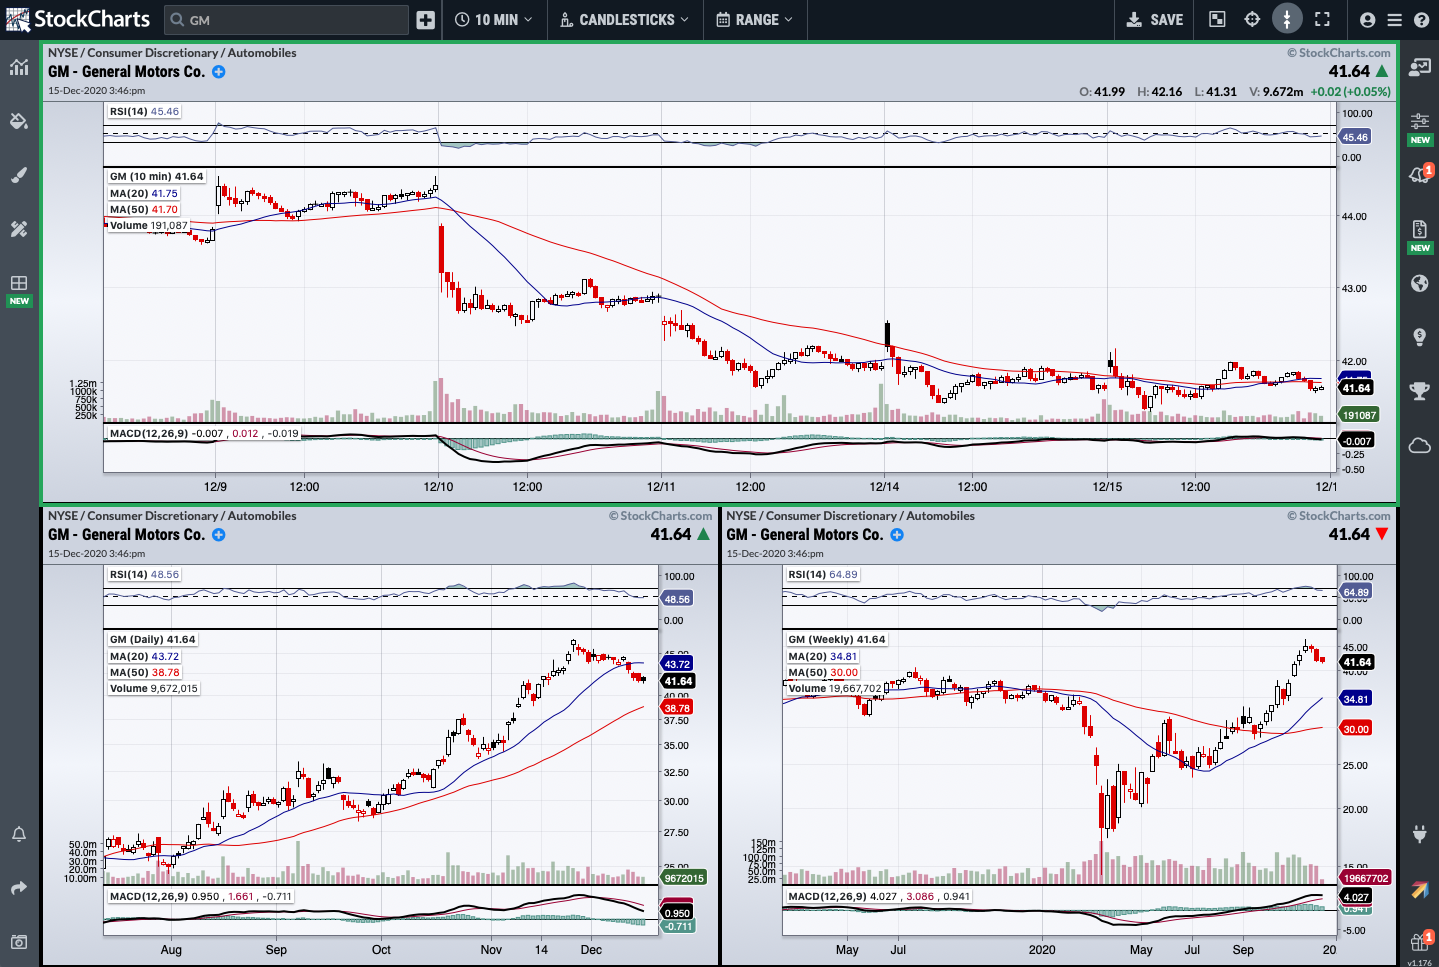
If you have more than one chart in your layout that has the same ticker symbol, Sync Options allow you to change the symbol for all those charts at once. With this functionality, you could add long-, medium-, and short-term charts for a single symbol to your layout, then quickly change all three charts to a new symbol by entering a new ticker in the Symbol box at the top of the screen (similar to GalleryView charts).
By default, Sync Options are disabled and each chart's symbol is updated independently.
There are currently two ways to sync charts in your layout that have the same symbol:
- Click the Checkerboard icon at the top of the screen to turn on this Sync Option.
- In the Sync Options section of the Layouts tab, check the box for Symbol.
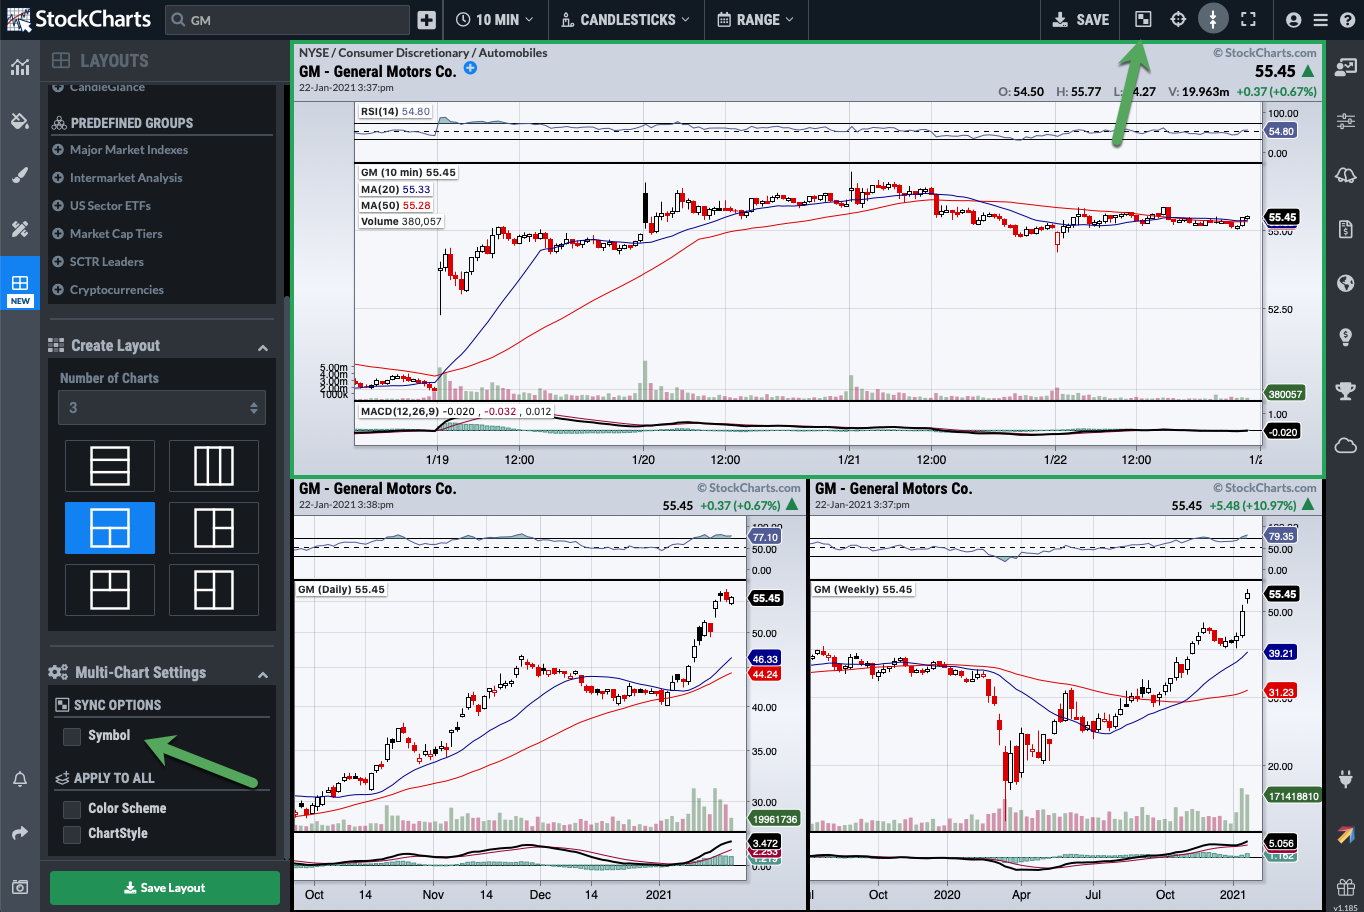
To turn off this Sync Option, either click the Checkerboard icon again or uncheck the checkbox on the Layouts tab.
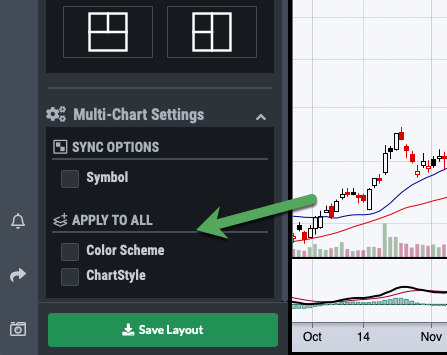
Apply To All
These settings allow you to apply a Color Scheme and/or a ChartStyle to all charts in the current layout at once, rather than having to update each chart in the layout individually. There are two ways to access this setting.
First, both checkboxes are available in the Multi-Chart Settings section of the Layout Panel:
There is also a corresponding checkbox for each at the top of the Color Schemes panel and at the top of the ChartStyles panel:
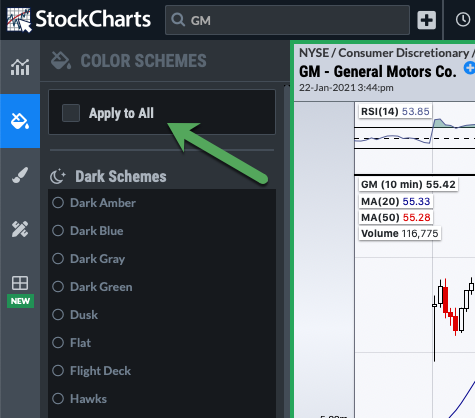
These checkboxes are unchecked by default. When the Color Schemes box is checked, any new color scheme you select will be applied to all charts in the current layout. Similarly, while the ChartStyles box is checked, any ChartStyle selections will be applied to all charts in the layout.
To return to updating charts individually, simply uncheck the relevant checkbox.
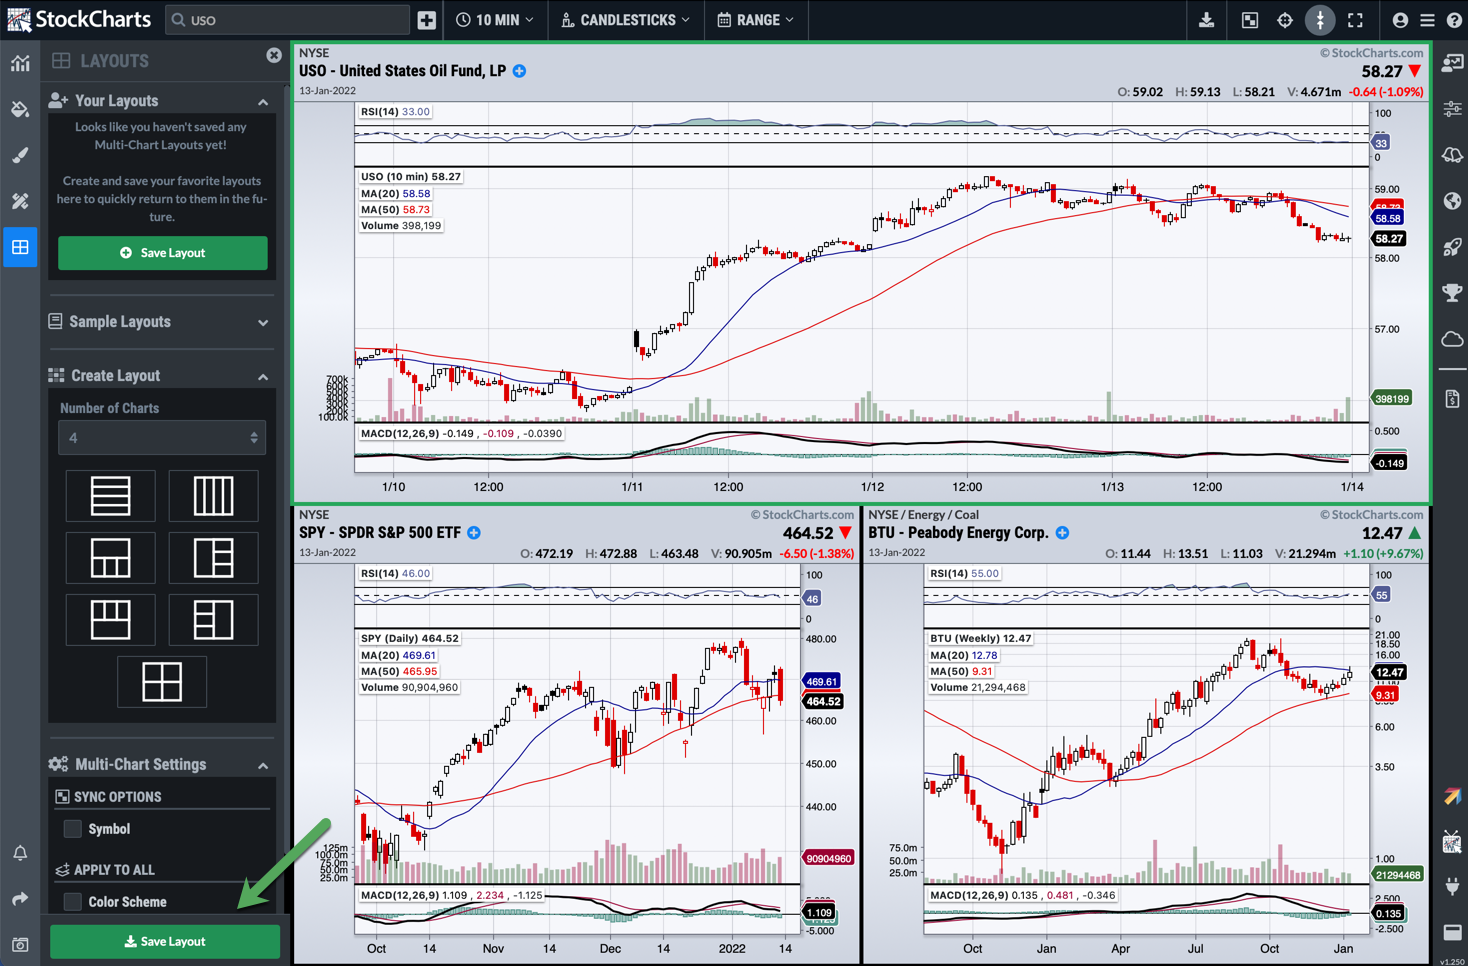
Saving a Custom Layout
If you find yourself setting up the same layout over and over again, it is helpful to save that layout so it can be easily reapplied in the future.
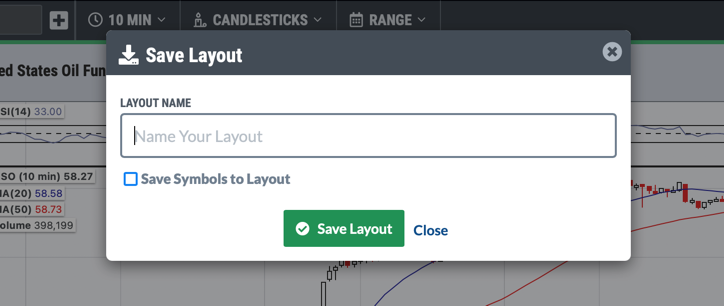
Once you have the charts configured the way you'd like in your layout, you can save it by going to the Layouts panel and clicking the green Save Layout button at the bottom of the panel.
Enter a name for your new layout. If you would like the specific symbols saved as part of the layout, check the “Save Symbols to Layout” box. Click the Save Layout button to save your layout.
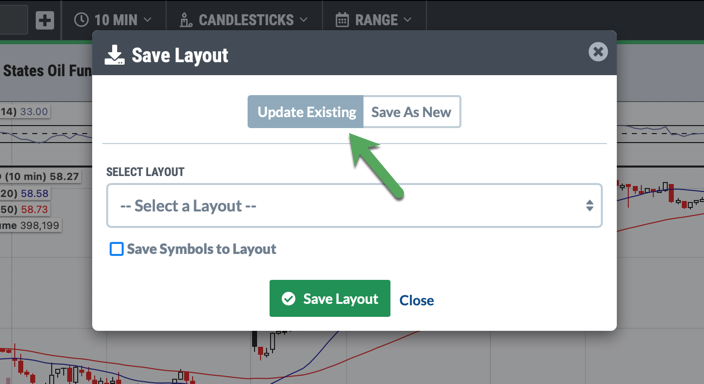
If you'd like to update an existing saved layout instead, choose the “Update Existing” tab instead, select the desired saved layout from the list, update the “Save Symbols to Layout” setting if needed, and click the Save Layout button.
Your saved layout contains the number of saved charts and their placement in the layout, plus all the settings for each chart. Essentially it saves everything except the symbols themselves. If you checked the “Save Symbols to Layout” checkbox when saving, then it saves everything including the symbols themselves.
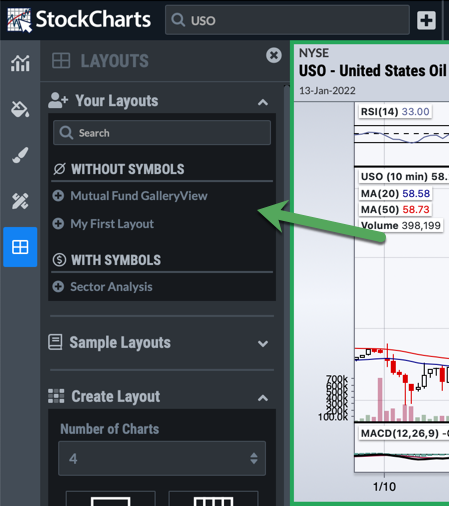
Your saved layouts are listed at the top of the Layouts panel, divided into those saved without symbols and those saved with symbols:
See Applying an Existing Layout for more information on applying your saved layouts.
Note: Only StockCharts members can create and save custom layouts. Basic members can save a single layout; Extra members can save up to 25 layouts, and Pro members can save up to 50 layouts.
Modifying a Custom Layout
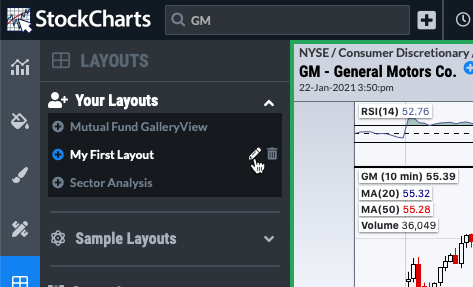
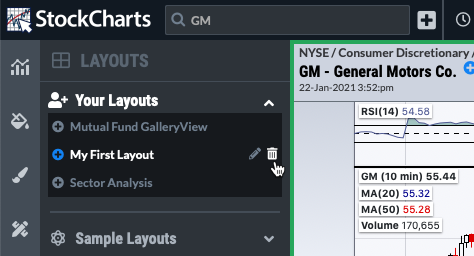
Your custom saved layouts can be edited or deleted from the Your Layouts section of the Layouts panel.
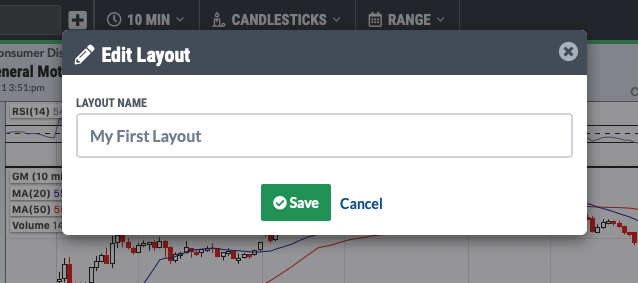
Editing the Layout Name
To edit the layout name, mouse over the layout and click the Pencil icon:
Enter the new name for the layout and click the green Save button:
Deleting a Saved Layout
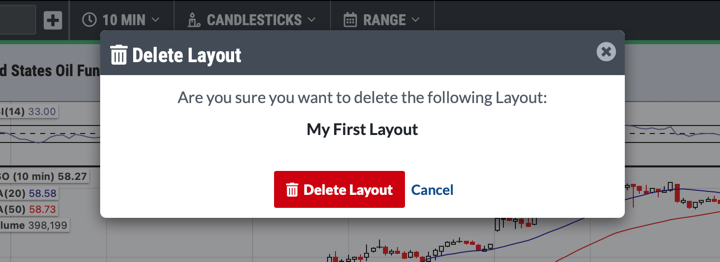
To delete a layout, mouse over the layout and click the Trash Can icon:
You will be asked to confirm that you want to delete that layout.
Enlarging a Single Chart in the Layout
When you have multiple charts in your layout, it can be handy to enlarge one chart so you can see more detail. To do this, mouse over the chart you want to enlarge. Next to the Chart Control Buttons at the bottom of the chart, there is a new button showing two arrows pointing in opposite directions. Click this button to maximize your chart.
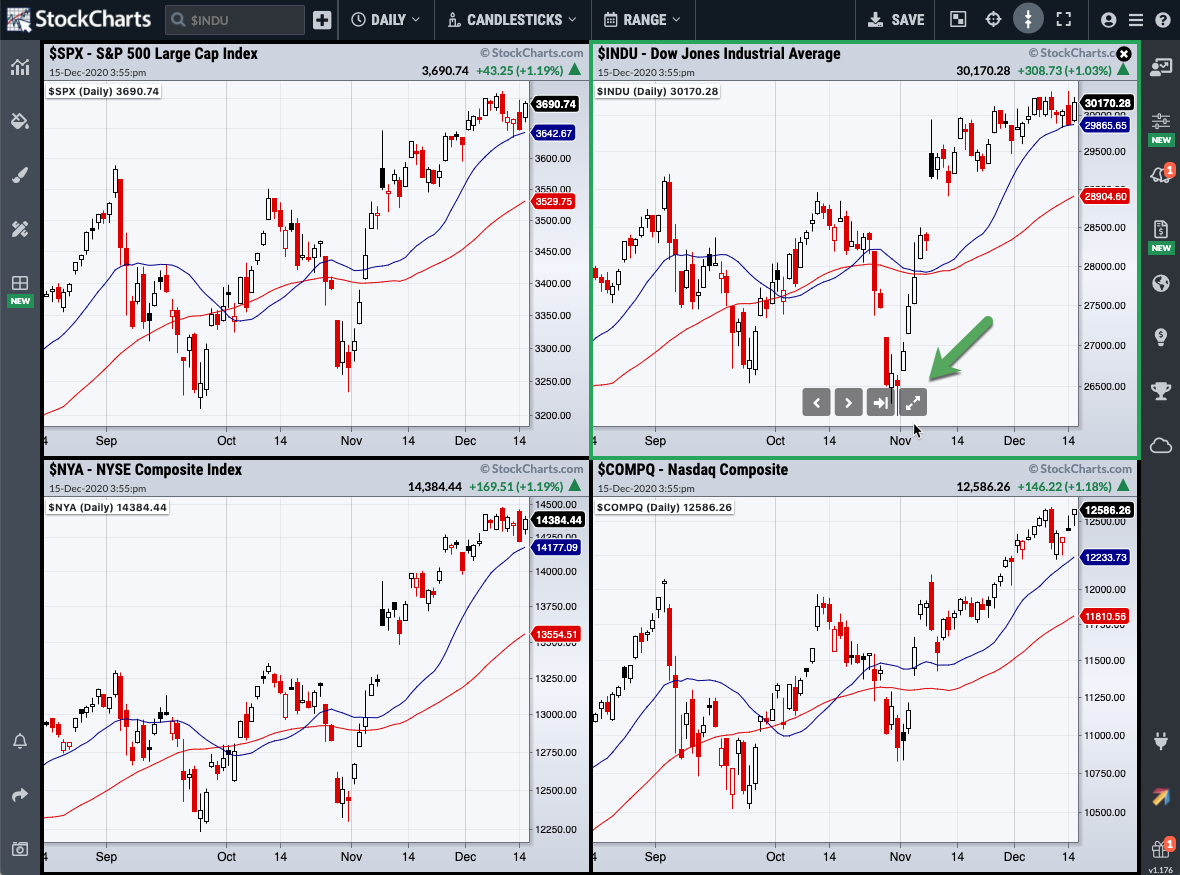
The chart will expand to take up the entire layout area. The green border will remain around the maximized chart to remind you that there are other layout charts behind it.
When you are ready to reduce the chart back down to its normal size in the layout, mouse over the chart again to display the Chart Control Buttons, and click the button with two arrows pointing towards each other. This will shrink your chart back to its normal size and allow you to see the other charts in the layout again.
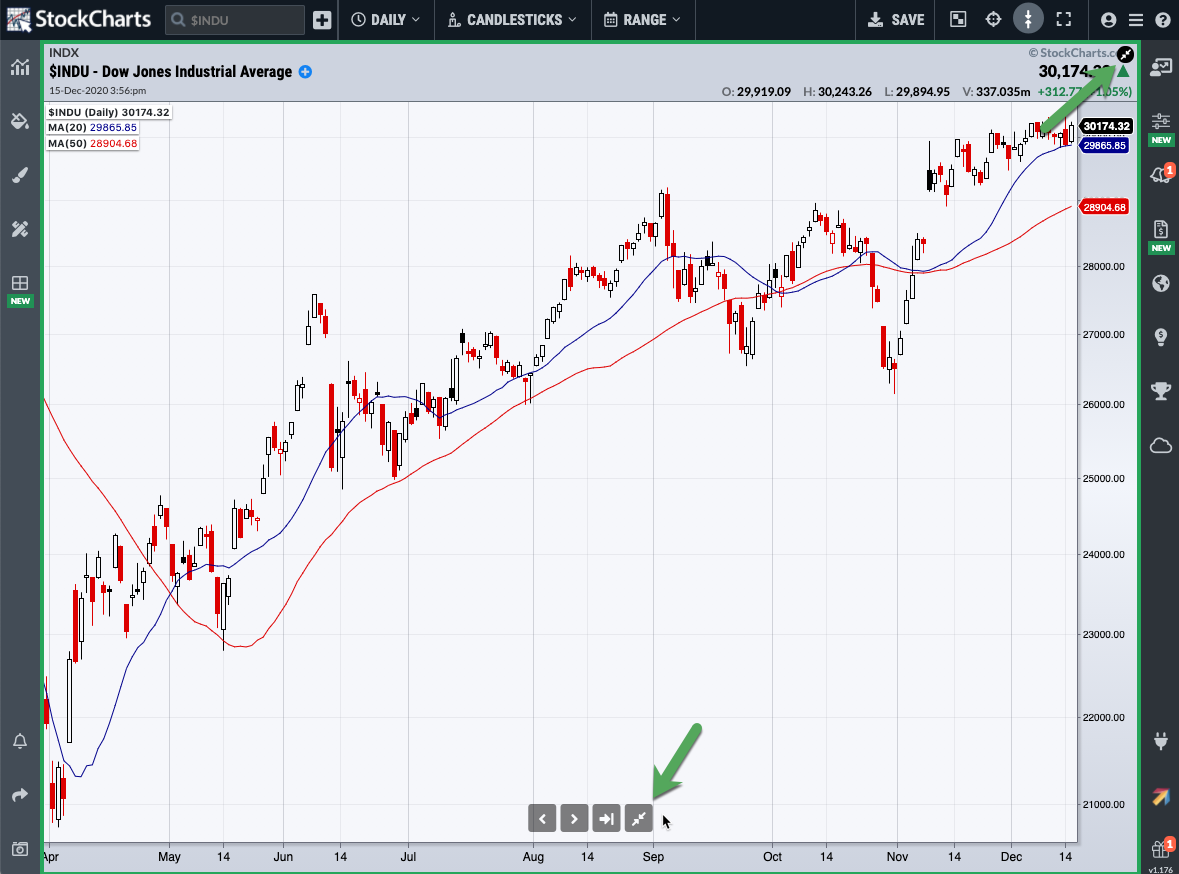
Note: You can also click the Shrink button in the top right corner of the chart to reduce the chart down to its normal size in the layout.