Table of Contents
MarketGauge Plug-Ins
Welcome to the Triple Play Indicators, Real Motion, and Opening Range Indicators plug-ins from MarketGauge. These three StockChartsACP plug-ins feature tools to identify and act on trends quickly.
We'll start with the Triple Play Indicators.
Triple Play Plug-In
The best trend trades are in stocks and exchange-traded funds (ETFs) that're leading the market up (or down). And when the stocks or ETFs have supporting volume trends powering the move, the trades can be more reliable. The Triple Play plug-in enables you to quickly identify the trends in stocks and ETFs with either the strength to continue or a hidden weakness that will likely lead to an unexpected reversal.
This plug-in includes two indicators: the MarketGauge Leadership Line and the MarketGauge Volume Trend Line. You can combine these two indicators with Bollinger Bands to find setups that could lead to explosive moves.
Check out the video below to lean more about the MarketGauge Triple Play Leadership indicators and explore different ways to use them to find the market leaders.
MarketGauge Leadership Line
This trend indicator measures leadership in multiple time frames so you can spot emerging leaders and failing trends quickly. With this indicator, you’ll easily discover stocks and ETFs with strong leadership trends. The indicator can be used on both short-term and long-term charts. By default, the security is compared to SPY, but that benchmark can be changed in the indicator settings.
MarketGauge Volume Trend Line
This volume trend strength indicator enables you to confirm the strength of price trends and identify developing bullish and bearish conditions before they show up in the price trend. With this indicator, you won't have to analyze volume bars to know when the volume activity is bullish or bearish. The indicator can be used on both short-term and long-term charts.
Real Motion Plug-In
Price trends are influenced by several factors, some of which we can't see in the price charts alone. One of the invisible factors is momentum. As a trader or investor you know that momentum has a huge impact on price trends. The Real Motion indicator in this plug-in enables you to do the following:
- Detect a trend before the crowd
- Spot leadership
- Identify divergences that could lead to a reversal
The Real Motion indicator can be used on short- and long-term charts. This indicator is listed twice in the ACP indicator list for ease of setup: one defaults to a 200- and 50-period configuration, and the other with a 50- and 10-period configuration. You can modify these values to align with your trading needs. To learn more about this indicator, check out the video below.
Using the Plug-Ins
The Triple Play and Real Motion plug-ins from MarketGauge are frequently used in concert, by adding all three indicators to a single chart.
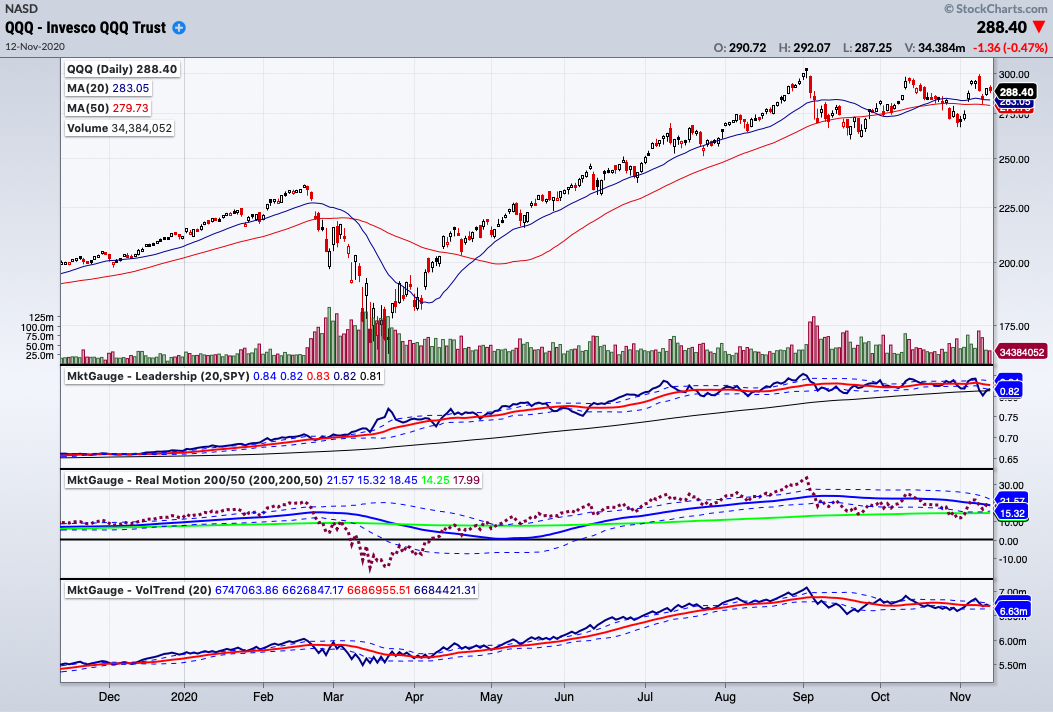
The Leadership Line indicator shows how the stock is performing relative to a benchmark, the Volume Trend Line indicator monitors performance trends in volume, and the Real Motion indicator compares price trends to momentum trends. Together, they give a comprehensive picture of the security's performance.
Opening Range Indicators
If you’re viewing daily charts, the opening range is the first x number of minutes in the trading day. The number of minutes varies among traders and is determined by your preferences. Most traders consider the opening range to be the first 30 minutes of the trading day. That means the OR will be defined as the price range or high to low at 10 AM. The OR indicator will mark the highest high and lowest low at 10 AM.
The Importance of OR
The first 30 minutes of trading is important because investors react to pre-market news or determine how their analysis after the prior day’s close is playing out. The first 30 minutes tend to be active because it’s the first chance traders have to trade based on their overnight conclusions.
How to Apply the OR Indicator
If price breaks out above its OR, it indicates bullish price action. If price continues higher, you can consider opening a long position. Conversely, if price breaks below its OR, it indicates a bearish bias. If it continues lower, you could open a short position. You could also use the opening range to help determine when to take losses or at what price a stock will likely reverse.
Intraday OR
To plot the intraday OR, do the following:
- In StockChartsACP, type in the symbol and bring up an intraday chart.
- From the Advanced Indicator Pack, scroll down to MG - Opening Range and select Opening Range Intraday
- This will display the opening range for the period you select. In the chart below, the 30-minute time frame was used.

Monthly OR
To plot the monthly OR, do the following:
- In StockChartsACP, type in the symbol and bring up a daily chart.
- From the Advanced Indicator Pack, scroll down to MG - Opening Range and select Calendar Range - Monthly.
- This displays the OR for the first trading day of the month.
You can apply a trading strategy similar to that of the Intraday OR.

Six-month OR
To plot the six-month OR, do the following:
- In StockChartsACP, type in the symbol and bring up a daily chart.
- From the Advanced Indicator Pack, scroll down to MG - Opening Range and select Calendar Range - 6-Month.
- You’ll see two ranges displayed on your chart. One is the range for the first trading day of the year and the first 10 trading days of the year. This range forms in January and July.
