Table of Contents
Simpler Trading Moxie Indicator Plug-In
Welcome to the Moxie IndicatorTM plug-in from Simpler Trading. This StockChartsACP plug-in features four Moxie IndicatorTM components - tools that Simpler Trading's TG Watkins never trades without. Used together, they allow you to analyze stocks in multiple timeframes and identify big moves before they happen.
Check out our Simpler Trading Moxie IndicatorTM overview video below, or just read on to learn how to get the most out of this plug-in.
Moxie Auto
The Moxie IndicatorTM, developed by TG Watkins of Simpler Trading, is an energy/momentum indicator that shows the strength of a price move. TG recommends using it along with a 50-period SMA of price to identify buy and sell signals.
Simply put, traders should buy when the Moxie IndicatorTM crosses above zero and price is over its SMA(50). Conversely, traders should sell when the Moxie IndicatorTM crosses below zero and price is below its SMA(50).
This indicator typically precedes price, so divergences between the Moxie and price can indicate an upcoming change. If price is below the SMA(50), but the Moxie is above zero, a rally is likely coming and traders may want to enter long; this is called a Trampoline Move. Conversely, if price is above the SMA(50), but the Moxie is below zero, price is likely to fall and long traders may want to exit; this is called an Inverse Trampoline Move.
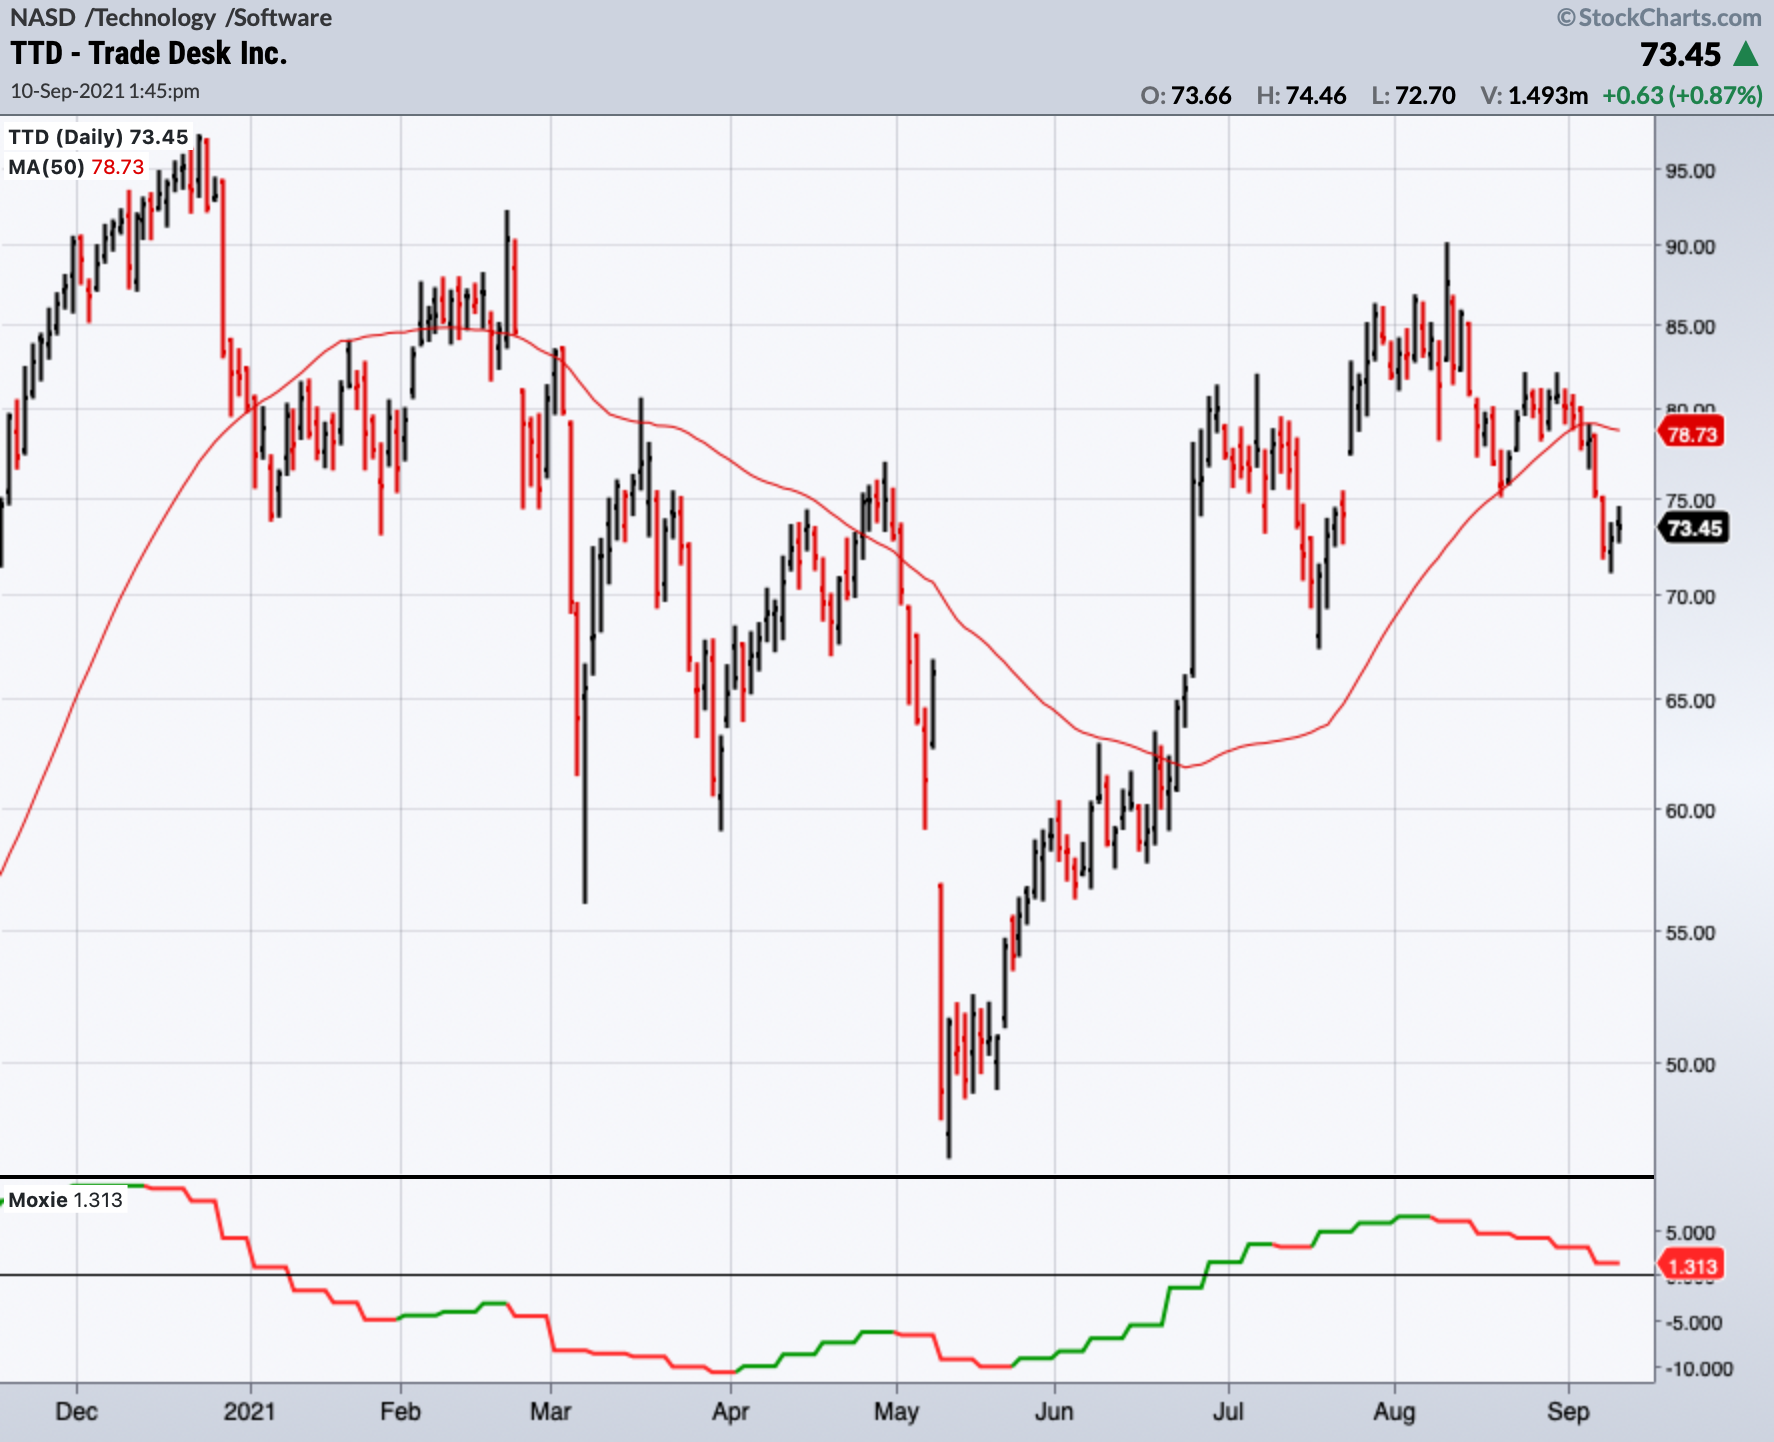
The Moxie Auto indicator can be used on weekly, daily, hourly, 5-minute, and 2-minute charts. Longer-term traders typically use daily and hourly charts, along with a 15-minute chart using the Moxie 15 High indicator described below. Intraday traders will typically use the 5-minute and 2-minute charts along with a 15-minute chart using the Moxie 15 Low indicator.
By default, the Moxie Auto indicator line is green when rising and red when falling, but these colors can be changed to suit your preferences.
Moxie Price Signals Auto
The Moxie Price Signals Auto indicator goes along with the main Moxie Auto indicator, and overlays arrows on the price plot corresponding with the Moxie Auto indicator crossing above or below the zero line. Indicating these crossovers right on the price plot can make it easier to identify entry and exit points.
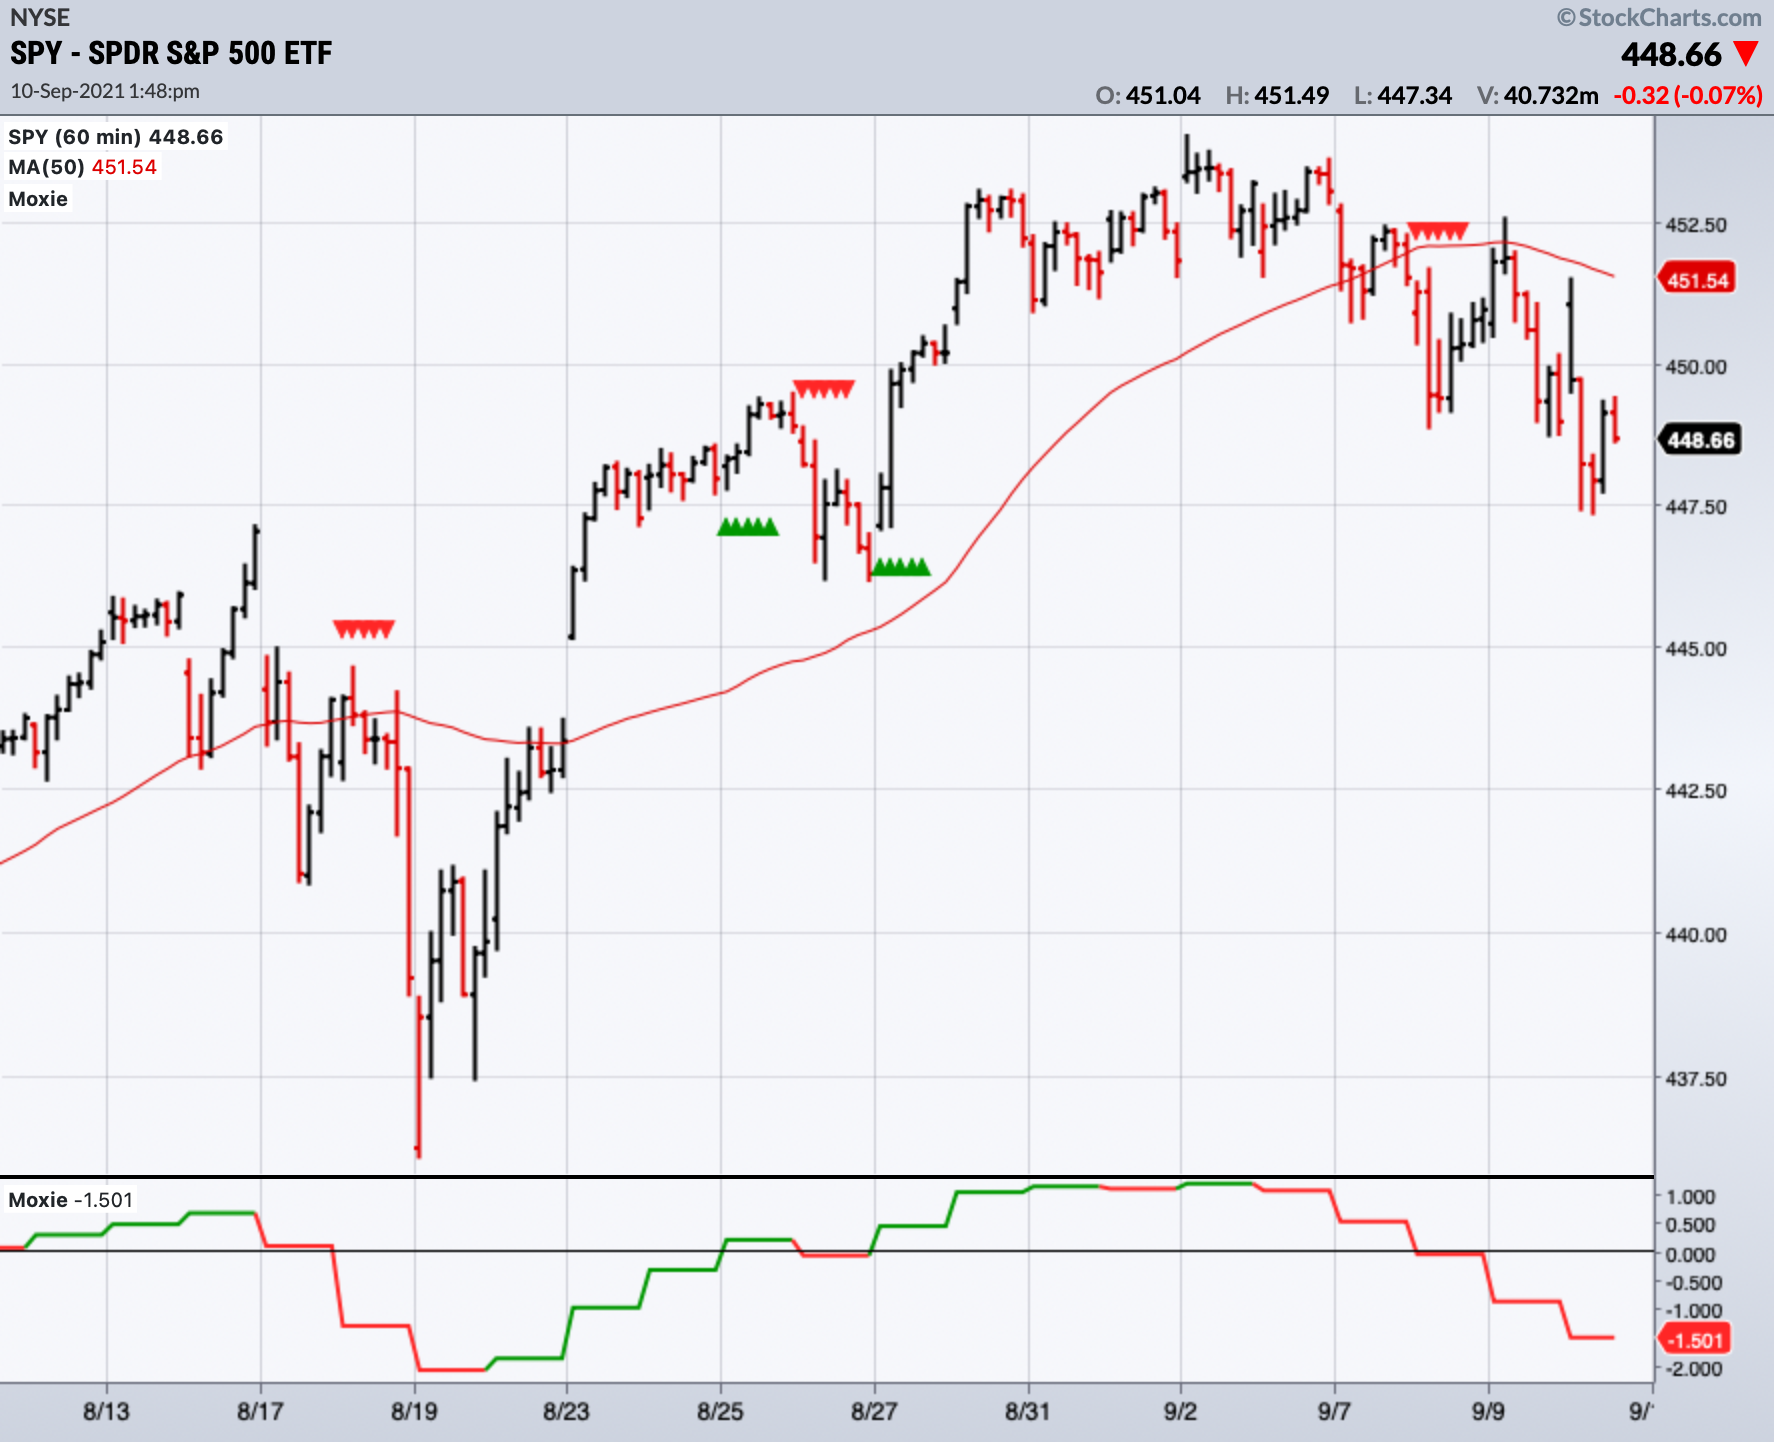
The Moxie Price Signals Auto indicator can be added to weekly, daily, and hourly charts. By default, the signal arrows are green when the Moxie Auto indicator crosses above zero and red when it crosses below, but these colors can be changed to suit your preferences.
Moxie 15 High and Moxie 15 Low
Like the Moxie Auto indicator, traders should look for crosses above/below the zero line, as well as divergences between price and the Moxie lines.
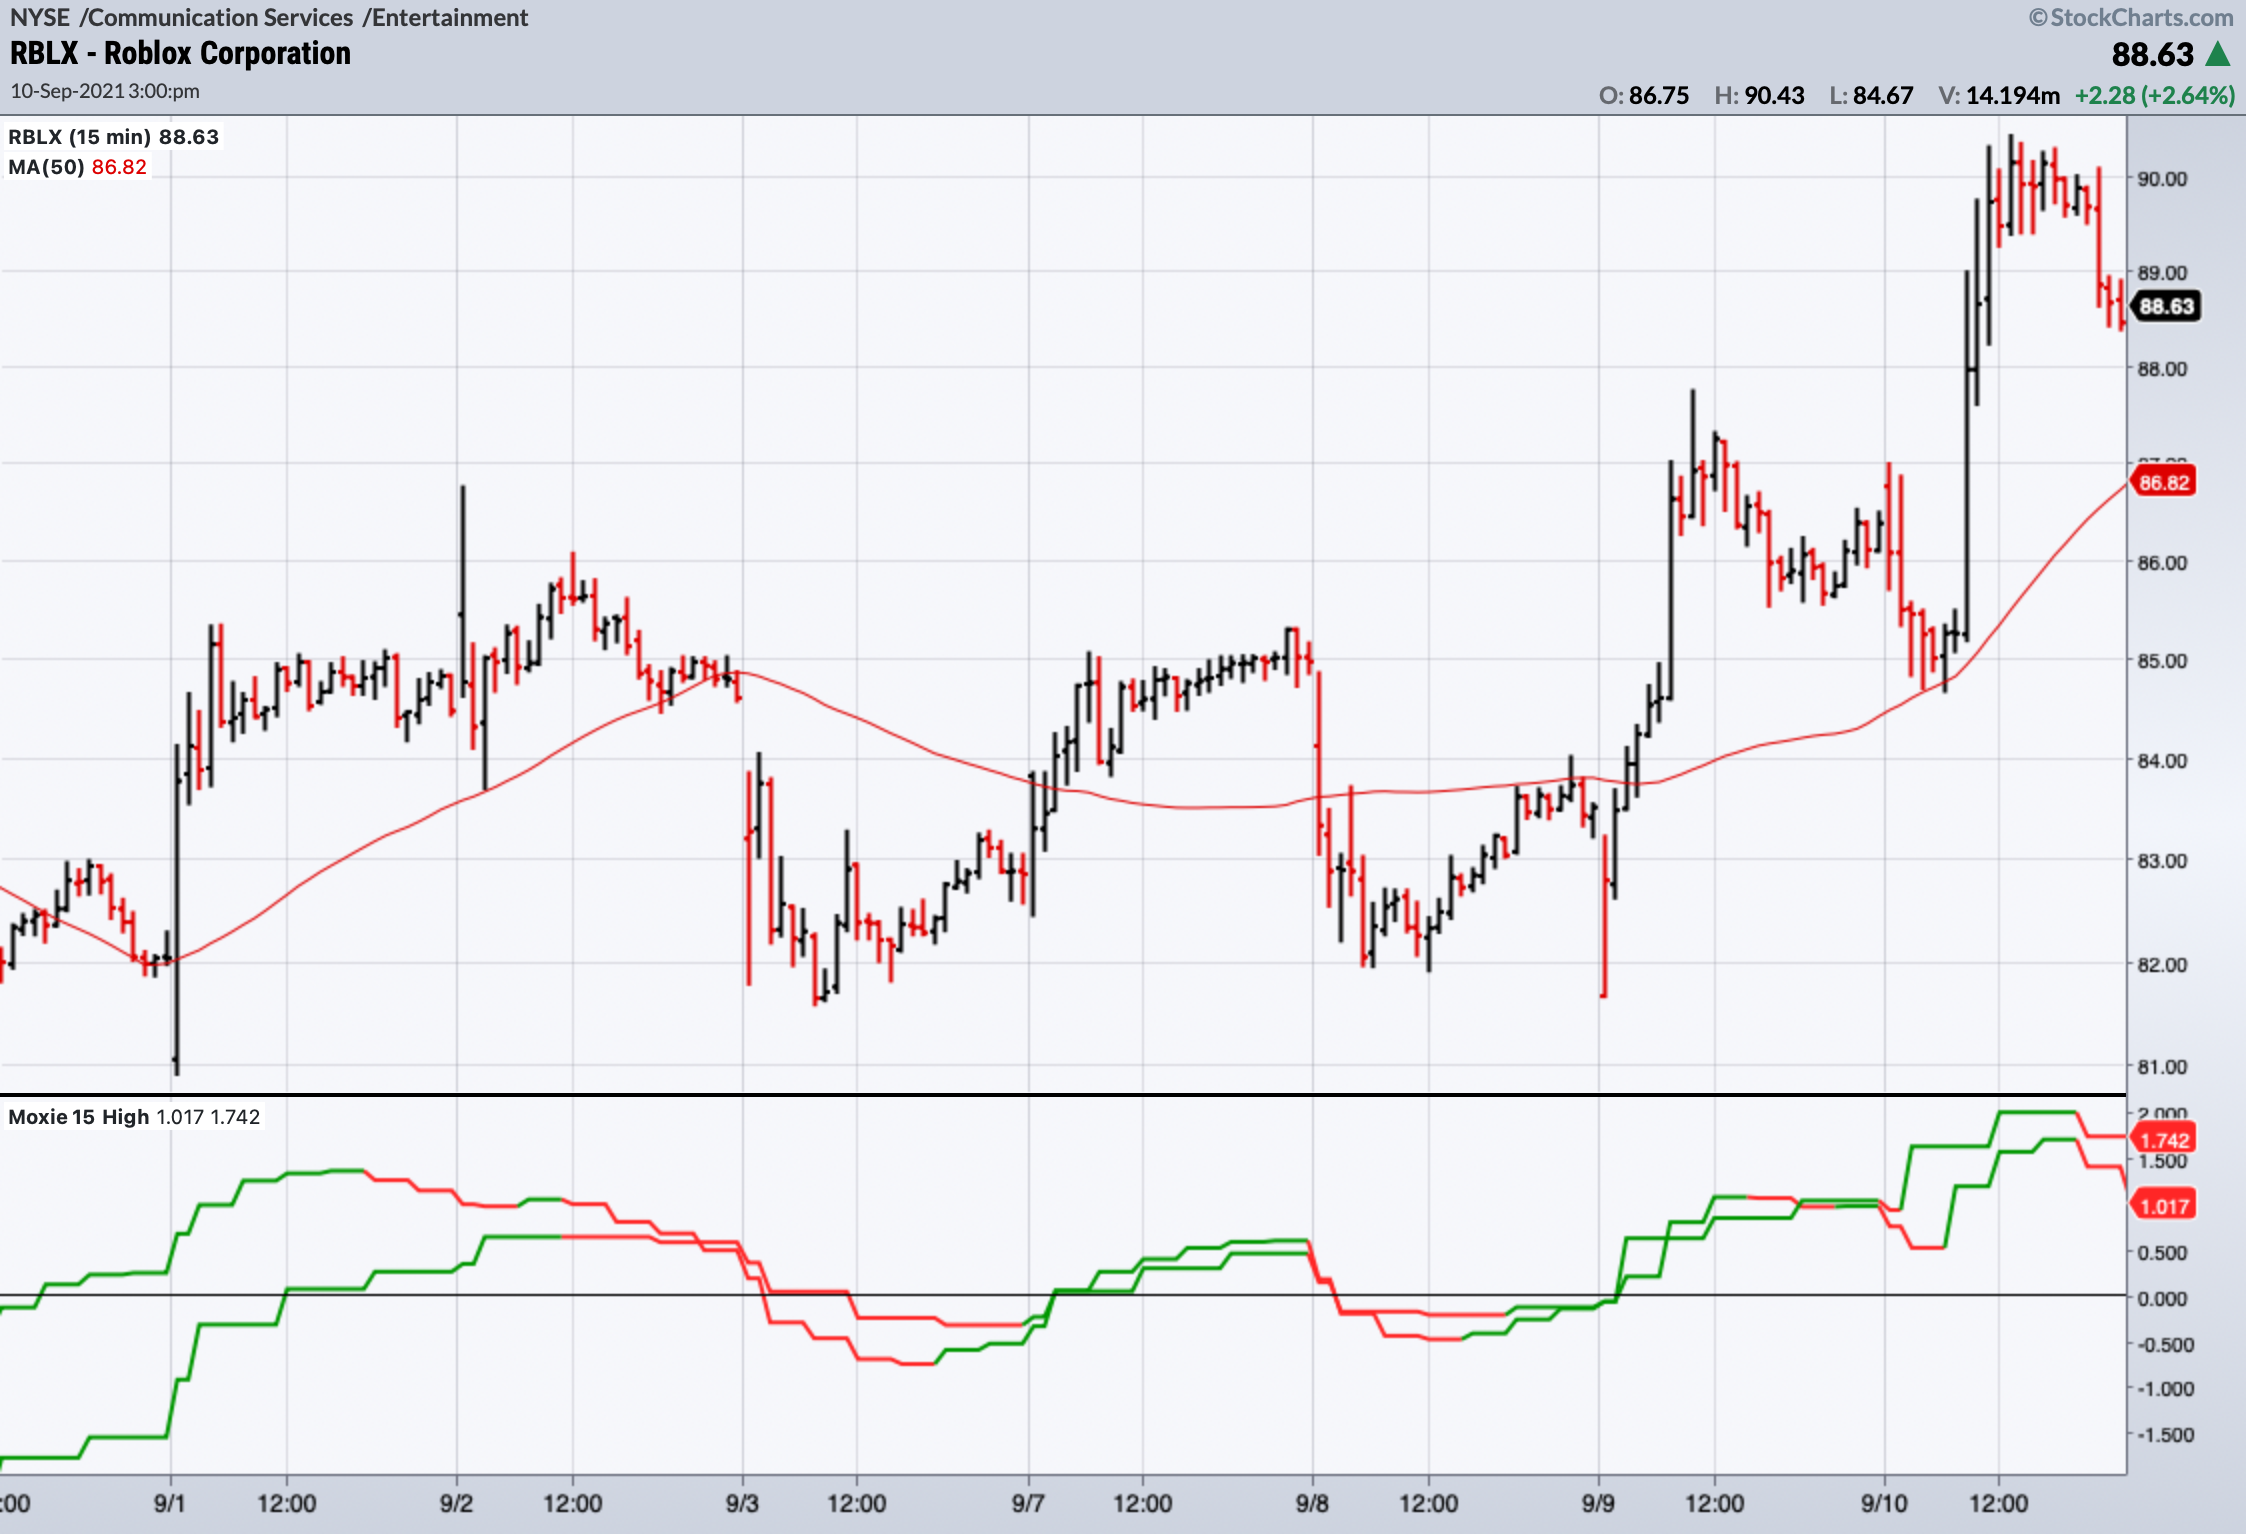
The Moxie 15 High and Moxie 15 Low indicators each have two Moxie lines instead of just one, and the relationship between the two lines indicates the strength of the signal. If the lines are green and trending up, but are spread far apart from each other (as in the FUBO chart below), this is a weak signal.
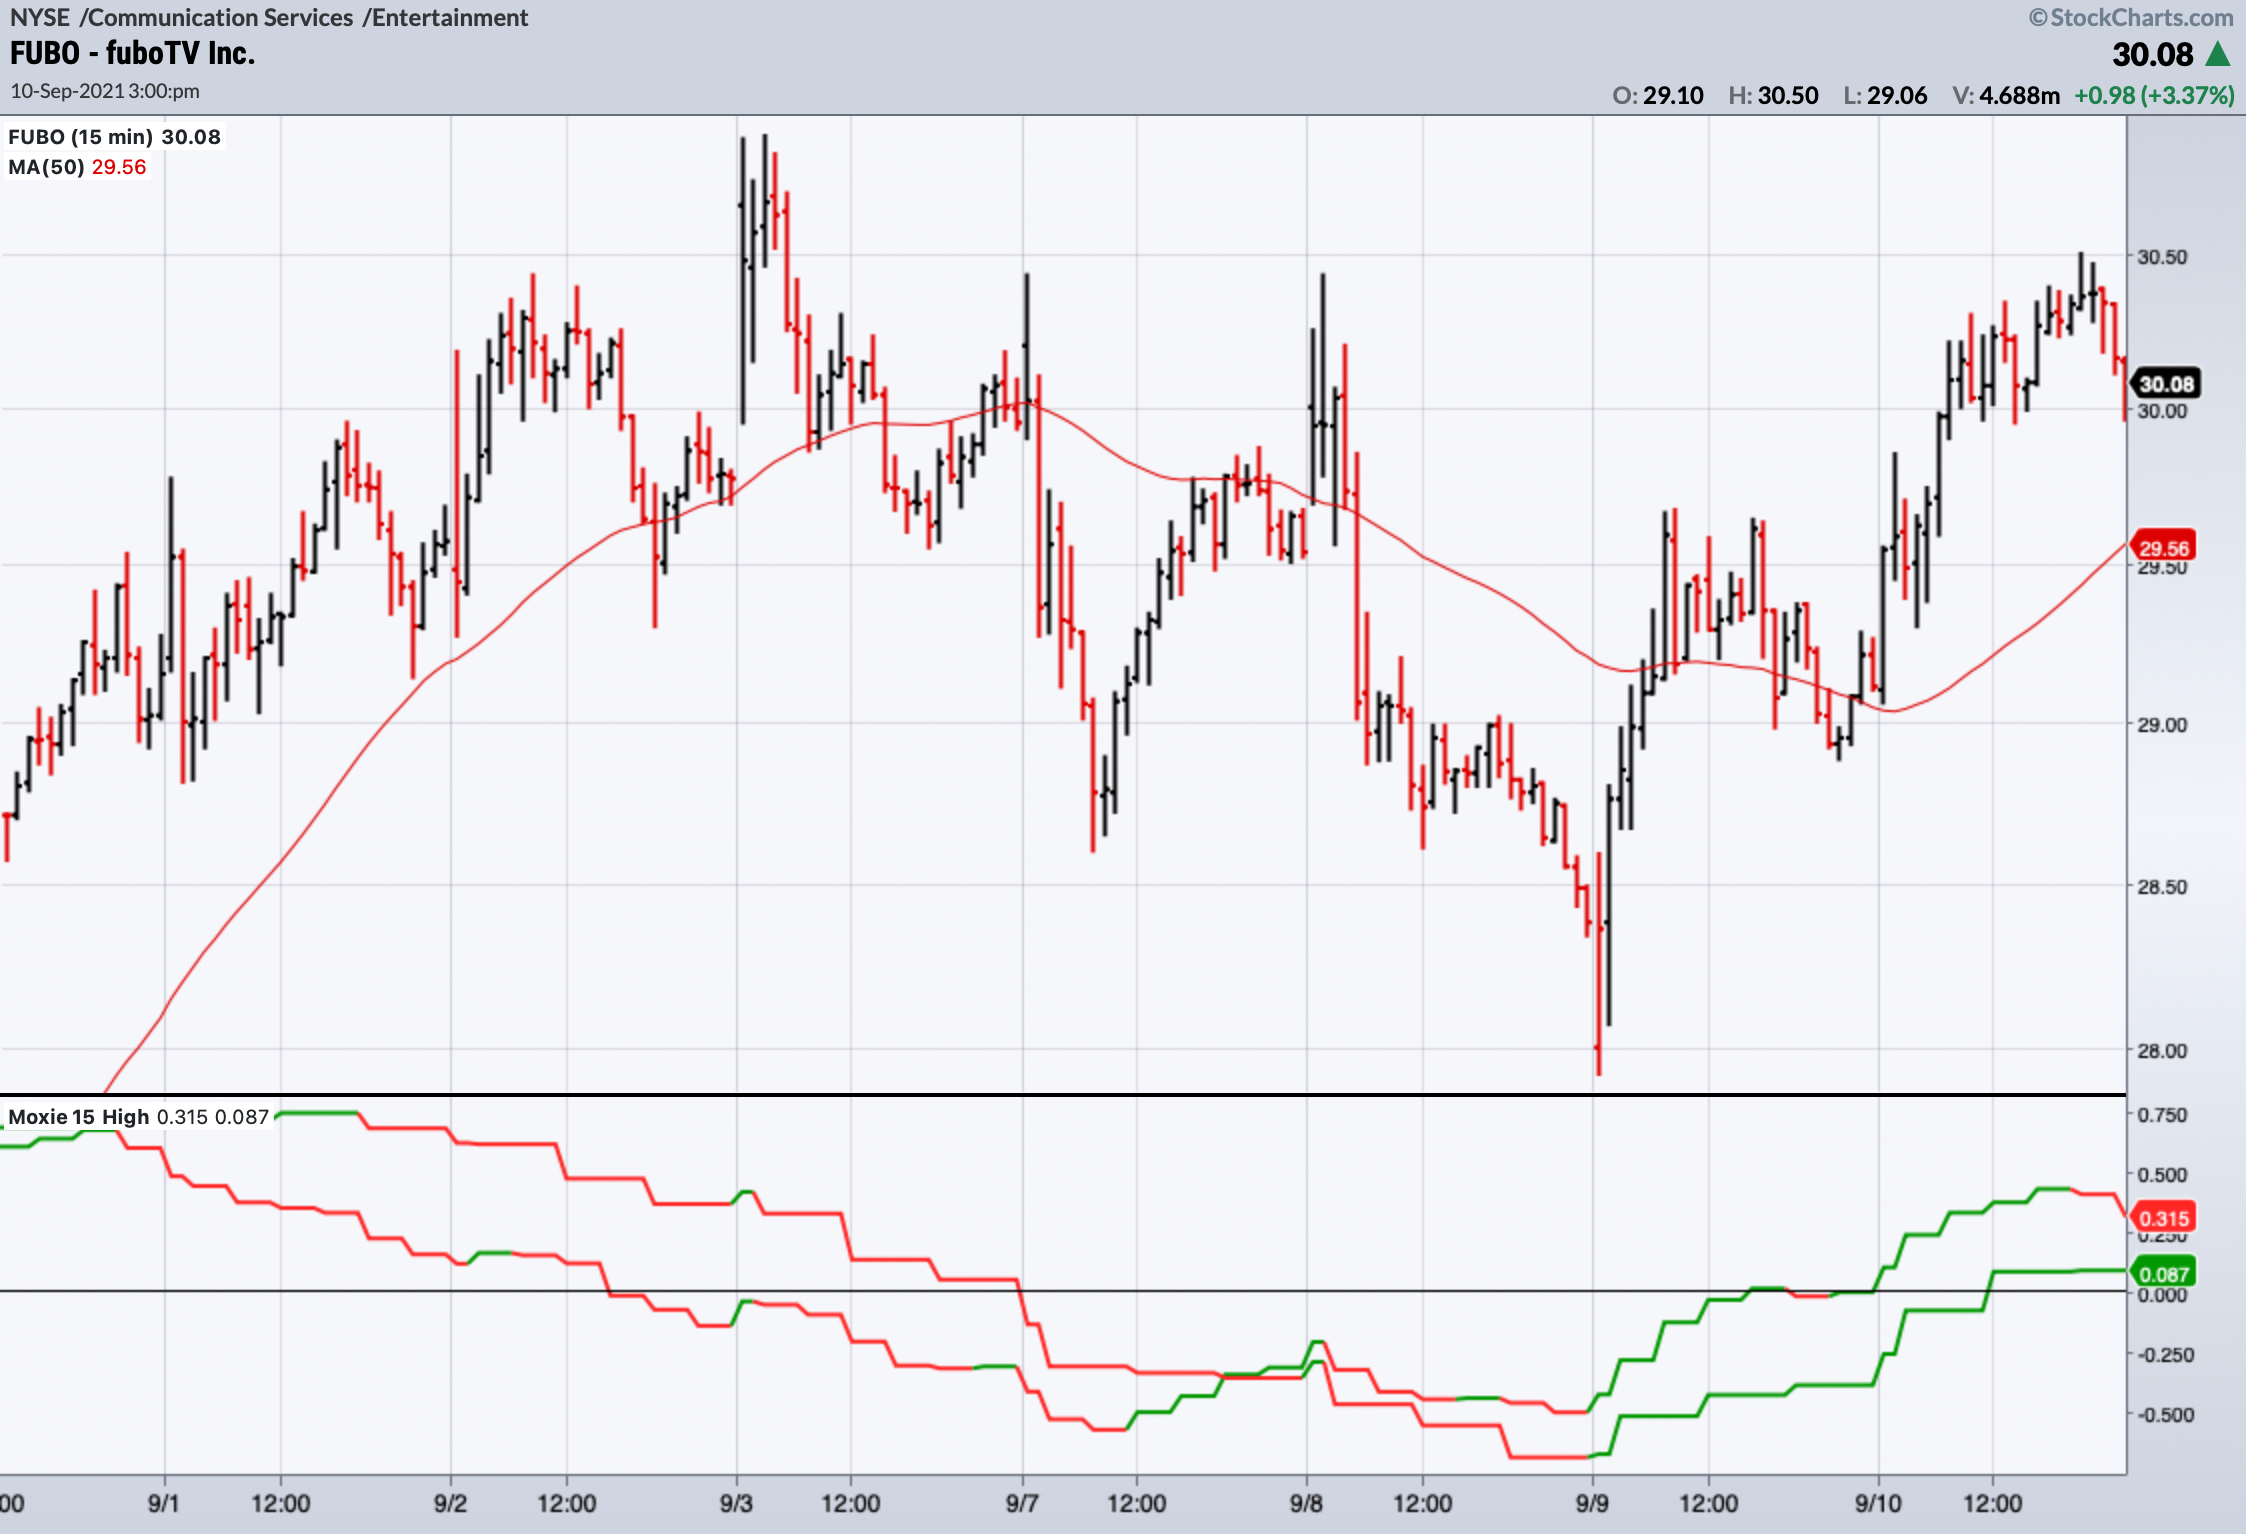
If the two Moxie 15 lines are very close together (especially if they appear as a single line), this indicates a stronger signal. The RBLX chart below shows two lines that are very much intertwined, which is a strong signal.
The Moxie 15 High and Moxie 15 Low indicators can be added to 15-minute charts. The Moxie 15 High is slower but stronger, and is typically paired with hourly and daily Moxie Auto indicator charts for swing trading. The Moxie 15 Low is more nimble, and is typically used for intraday trading, along with 5-minute and 2-minute Moxie Auto indicator charts.
By default, the Moxie 15 High and Moxie 15 Low indicator lines are green when rising and red when falling, but these colors can be changed to suit your preferences.