Table of Contents
TIP Indicator Edge Plug-In
Welcome to the Indicator Edge plug-in from TrendInvestorPro.com. This StockChartsACP plug-in features twelve indicators that can be divided into three general groups: trend-following, mean-reversion and volatility. Some of these indicators can be used for both trend-following and mean-reversion. For example, StochClose(125,5,1) covers six months and is considered a trend-following indicator, while StochClose(14,3,3) covers just 14 days and is better suited as a mean-reversion indicator.
Caveat Emptor! These indicators are not the holy grail. They are designed to put price action into perspective and help traders understand the different environments. Among other things, these indicators will help you determine:
- Are we in a low volatility uptrend that favors trend-following?
- When are prices prime for a mean-reversion bounce?
- Which securities triggered the first trend signals and are the leaders?
- Are we in a volatile environment that points to above-average risk?
- How can I compare volatility from one security to another?
Check out our TIP Indicator Edge overview video below, or just read on to learn how to get the most out of this plug-in.
TIP Trend Composite
TIP Trend Composite quantifies and aggregates signals in five trend-following indicators:
- TIP Moving Average Trend
- TIP CCI Close
- Bollinger Bands
- Keltner Channels
- TIP StochClose
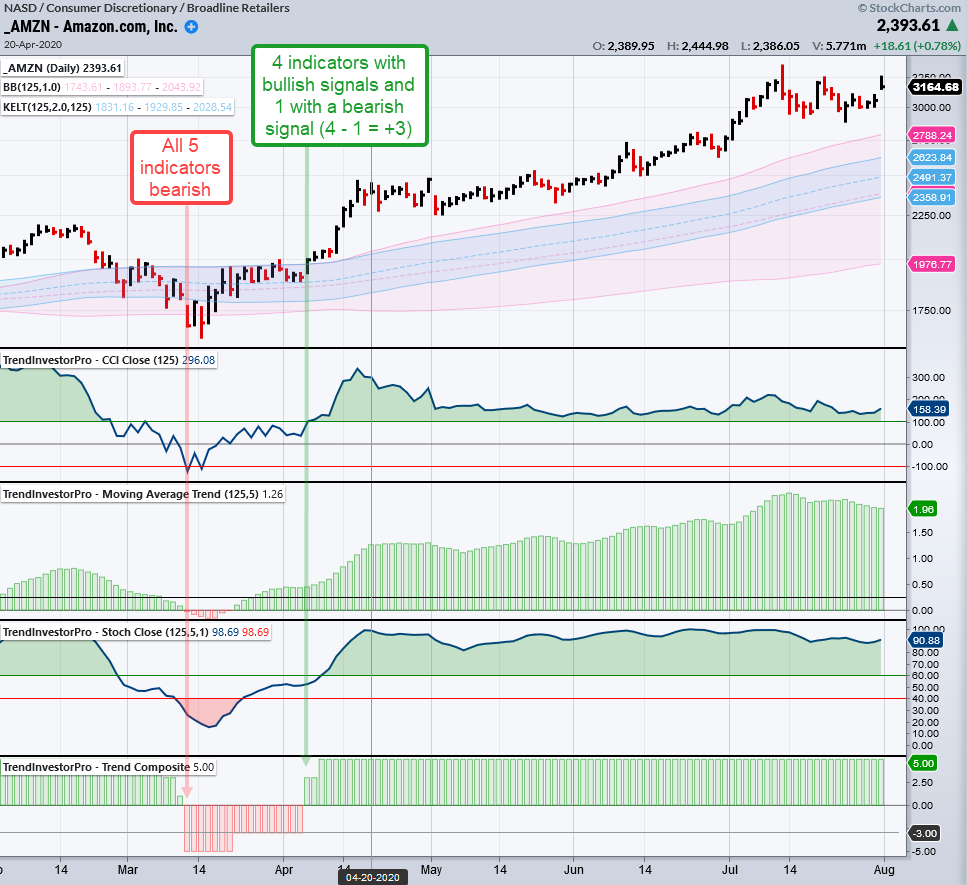
Each indicator is either on a bull signal (+1) or a bear signal (-1). TIP Trend Composite ranges from +5 to -5 and is always an odd number. For example, the indicator is +1 when three indicators are on bull signals (uptrends) and two are on bear signals (downtrends). The indicator is +5 when all five signals are bullish and -5 when all signals are bearish. The default settings are designed to capture three- to six-month trends, but these parameters can be changed according to preferences.
TIP Moving Average Trend (125,5) is a trend indicator that shows when a moving average is rising or falling. The default settings are 125 for the simple moving average and 5 for the Rate-of-Change. A move above zero triggers a bull signal and a move below zero triggers a bear signal. The bull/bear signal thresholds can be modified.
TIP CCI Close (125) is the 125-period Commodity Channel Index based on closing prices. The indicator triggers bullish with a move above +100 and a downtrend with a move below -100. The bull/bear signal thresholds can be modified.
Bollinger Bands (125,1) are set one 125-day standard deviation above and below the 125-day SMA. An uptrend triggers when price closes above the upper band and a downtrend triggers when price closes below the low band.
Keltner Channels (125,125,2) are set two ATR(125) values above and below the 125-day EMA. A bull signal triggers when price close above the upper line and a bear signal triggers when price closes below the lower line.
TIP StochClose (125,5) is the 5-day SMA of the 125-day Stochastic Oscillator based on closing prices. A move above 60 triggers a bullish signal and a move below 40 triggers a bearish signal. The bull/bear signal thresholds can be modified.
The example below shows Amazon (_AMZN) with all five indicators triggering bearish signals in mid-March and the Trend Composite hitting -5. The indicator group turned net bullish (+3) in early April when four indicators triggered bullish and one was still on a bearish signal (StochClose). StochClose turned bullish two days later to push the Trend Composite to +5.
TIP StochClose
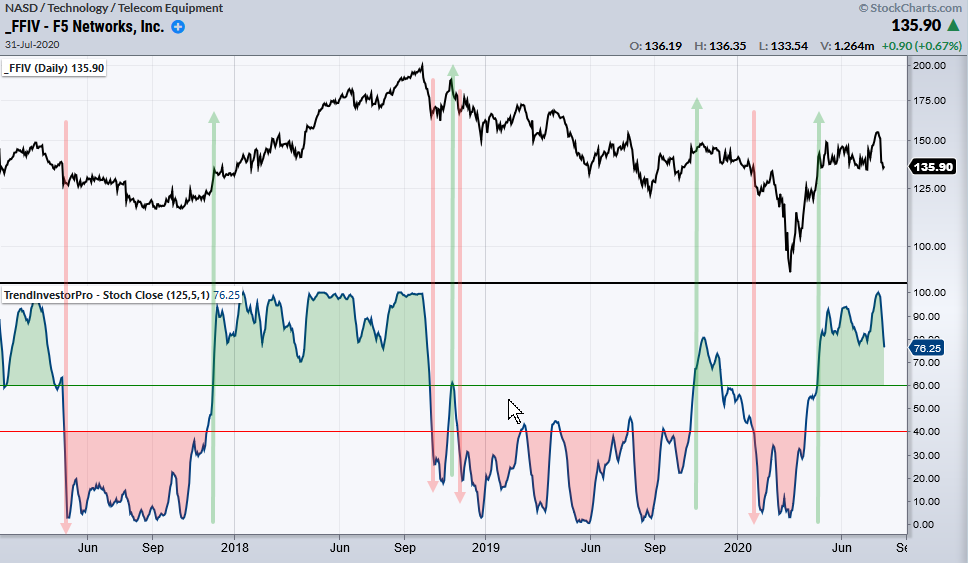
TIP StochClose is a trend-following indicator that filters out intraday high-low spikes to improve signal consistency. StochClose (125,5) is the 5-period SMA of the 125-day Stochastic Oscillator based on closing prices. In Stochastic language, this is %K that is smoothed with a 5-period moving average. A move above 60 signals an uptrend, while a move below 40 signals a downtrend.
The Stochastic Oscillator quantifies the level of the close relative to the high-low range over a given period of time. Using daily data, StochClose values above 90 indicate that price is near a 125-day high, which covers around six months. Values below 10 indicate that price is near a 125-day low. A move above 60 means price is clearly in the upper half of the range and signals an uptrend. Conversely, a move below 40 means price is clearly in the lower half and this signals a downtrend. The bull/bear signal thresholds can be modified.
Why base an indicator on closing prices? Indicators that use the intraday high and low are vulnerable to abnormal price spikes that can skew indicator values. This is especially true with ETFs, as seen by price action in August 2015 and March 2020. Intraday highs and lows are inherently more volatile than closing prices, and this volatility is reflected in indicators that use these highs and lows. Indicators based solely on closing prices will be less volatile and produce more consistent signals. Moreover, the closing price is the single most important price point of the day.
Note that StochClose can also be used as a traditional momentum oscillator for mean-reversion signals. 14-period StochClose with 3-period smoothing would be equivalent to the 3-period SMA of %K, which is used in the traditional Slow Stochastic. An optional signal line can be added by setting %D to 3.
The example shows F5 Networks (_FFIV) with several signals using StochClose (125,5,1) in trend-following mode. As with all trend-following signals, there were some good signals and some whipsaws (bad signals). The green and red arrows on the chart below show actual signals.
TIP RSI Trend Range
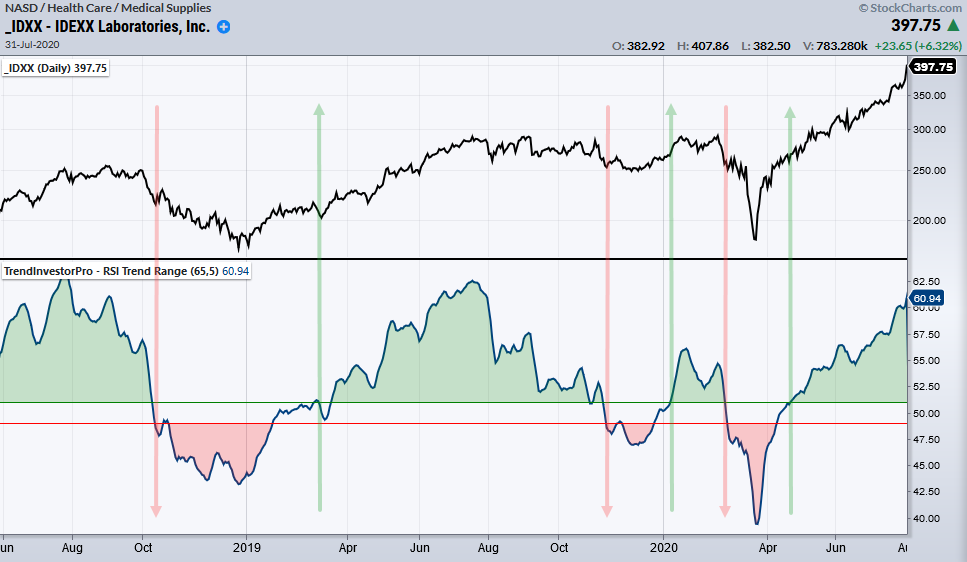
TIP RSI Trend Range is a trend-following indicator based on the Relative Strength Index. The default setting is 65 periods, which covers around three months on a daily chart. RSI is then smoothed with a 5-period SMA to reduce whipsaws.
RSI is bound between 0 and 100 with 50 as the midpoint. Prices are generally rising when RSI is above 50 and falling when RSI is below 50. The bullish/bearish thresholds for RSI Trend Range are set just above/below 50 to reduce whipsaws. A bullish signal triggers (uptrend) with a move above 51 and a bearish signal triggers (downtrend) with a move below 49.
The lookback parameters, smoothing periods and bull/bear signal thresholds can be adjusted according to user preferences.
The example below shows IDEXX Labs (_IDXX) with six RSI Trend Range signals.
TIP Moving Average Trend
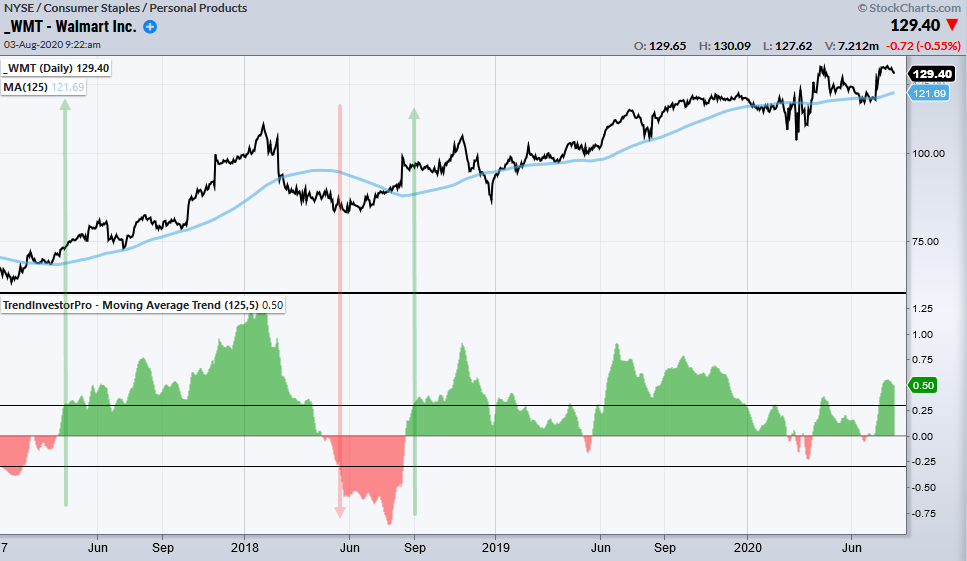
TIP Moving Average Trend is a trend-following indicator that shows when a moving average is rising or falling. The default settings are 125 for the simple moving average and 5 for the Rate-of-Change. On a daily chart, 125 days covers around six months. The six-month moving average is rising (uptrend) when its 5-period ROC is greater than 0 and the indicator is green. The moving average is falling (downtrend) when its 5-period ROC is less than 0 and the indicator is red.
Chartists can adjust the moving average, the Rate-of-Change periods and the upper/lower references to suit their timeframe and sensitivity. The Upper and Low Ref values can be used to further qualify signals. Instead of just a cross above/below the zero line, the Upper and Low Ref lines require a certain threshold to be met.
The example below shows Walmart (_WMT) with the 125-day SMA and the Moving Average Trend (125,5). The upper ref is set at +.3% and the lower ref is set at -.3% for signals. Notice how the indicator turns up (green) and down (red) more often than it exceeds the bullish and bearish thresholds. These thresholds require more meaningful changes and produce fewer whipsaws.
TIP Momentum Composite
TIP Momentum Composite is a mean-reversion indicator that quantifies and aggregates overbought/oversold signals in five momentum indicators. The indicators, default periods and overbought/oversold levels are as follows:
- RSI: 10 periods, overbought > 70 and oversold < 30
- %B: 20 periods, 2 standard deviations, overbought > 1 and oversold < 0
- StochClose: 20 periods, 1 period smoothing, overbought > 95, oversold < 5
- CCI Close: 20 periods, overbought > 200, oversold < -200
- Normalized ROC: 20 periods, overbought > 3%, oversold < -3%
Normalized ROC is the absolute 20-period Rate-of-Change divided by 20-period Average True Range (ATR).
The period settings as well as the overbought and oversold levels can be modified to increase or decrease sensitivity.
TIP Momentum Composite ranges from +5 to -5. An indicator counts -1 when oversold, +1 when overbought and 0 when neither overbought or oversold. TIP Momentum Composite is -3 when three indicators oversold and the other two are neither oversold nor overbought. The indicator is +4 when all four indicators are overbought and the other one is neither overbought or oversold.
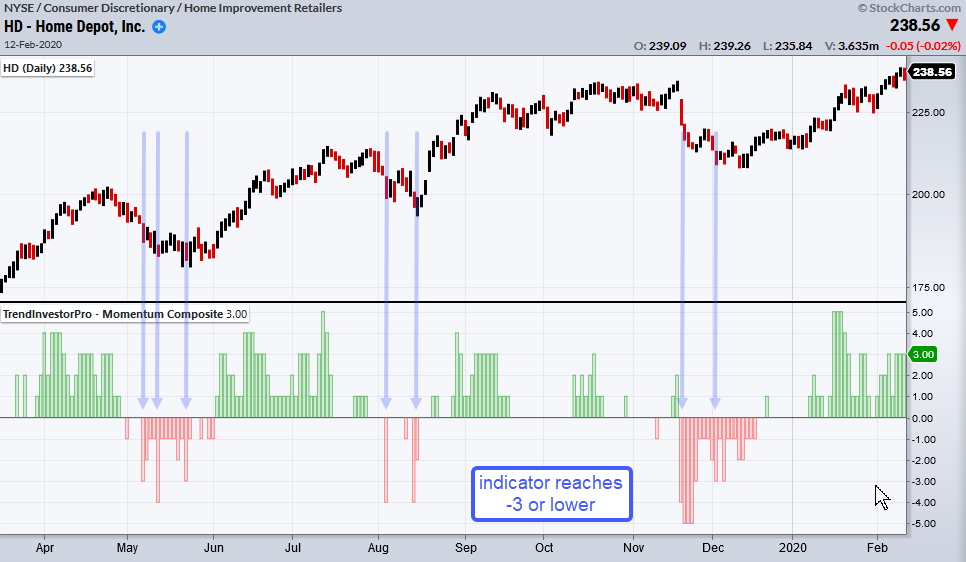
The example below shows Home Depot (HD) in an uptrend overall and the Momentum Composite dipping to -3 or lower at least seven times. This signals an oversold condition that can give way to a mean-reversion bounce. Notice, however, how these oversold readings can cluster and bounces are not always immediate. A bullish reversal is often becomes evident when one indicator hits overbought, which means the Momentum Composite hits +1.
TIP Percent Above MA
TIP Percent Above MA is a trend-following indicator that measures the percentage difference between the close and a simple moving average (SMA) or the difference between two SMAs. Basically, it is the Percentage Price Oscillator with SMAs instead of EMAs. Chartists also have the option to add a signal line.
The default setting is 1 period for the Fast SMA and 200 periods for the slow SMA. A 1-period SMA is the same as the closing price. As such, the indicator shows the percentage difference between the close and the 200-period SMA. The histogram is green when the close is above the 200-period SMA and red when below.
Chartists can set thresholds using the Upper and Lower Reference settings. These thresholds insure that price exceeds the moving average by a certain percentage. The default settings are 5% and -5%. For trend following, a move above +5% would mean the Fast SMA is 5% or more above the Slow SMA. Using these thresholds can prevent whipsaws by insuring a more meaningful cross.
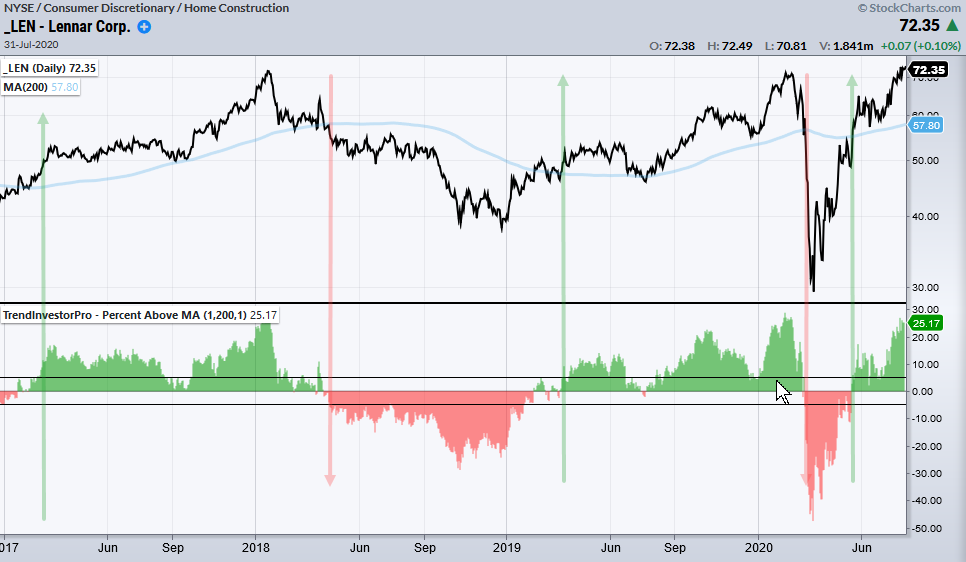
The example below shows Lennar (_LEN) with the Percent Above MA (1,200,1) turning red/green over a dozen times. The bullish and bearish thresholds, in contrast, were only breached five times.
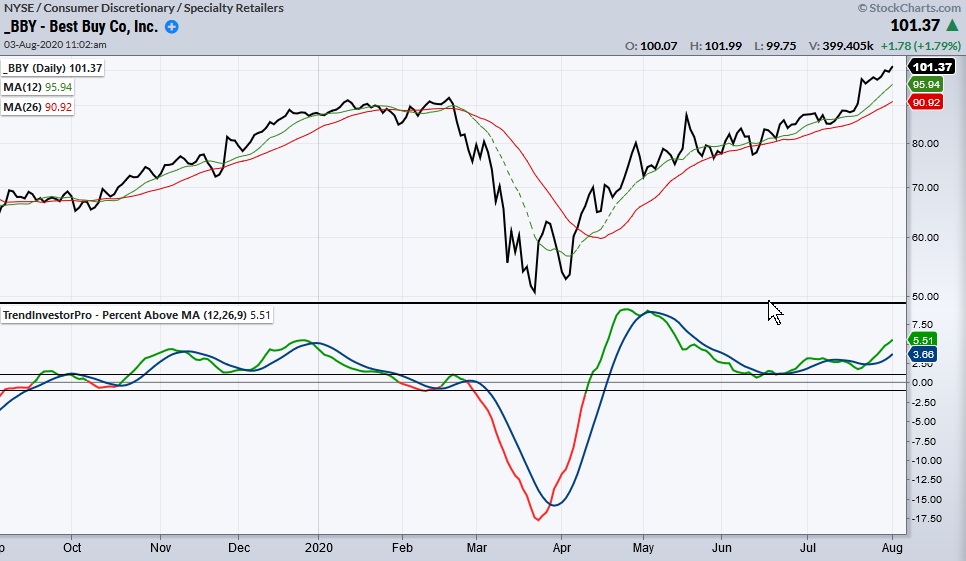
The second example shows Best Buy (_BBY) with Percent Above MA (12,26,9), which is the Percentage Price Oscillator (12,26,9) using SMAs instead of EMAs.
TIP CCI Close
TIP CCI Close is the Commodity Channel Index based on closing prices. The traditional Commodity Channel Index calculation uses the typical price, which is based on the intraday high and low. Indicators based on closing prices are less volatile and immune to intraday price spikes.
TIP CCI Close can be used just like the traditional CCI. 125-period CCI Close on a daily chart would be for trend-following. A move above +100 signals the start of an uptrend and a move below -100 signals the start of a downtrend. Alternatively, 20-day CCI Close can be used as a momentum oscillator to identify price extremes. The indicator is considered overbought when above +200 and oversold when below -200.
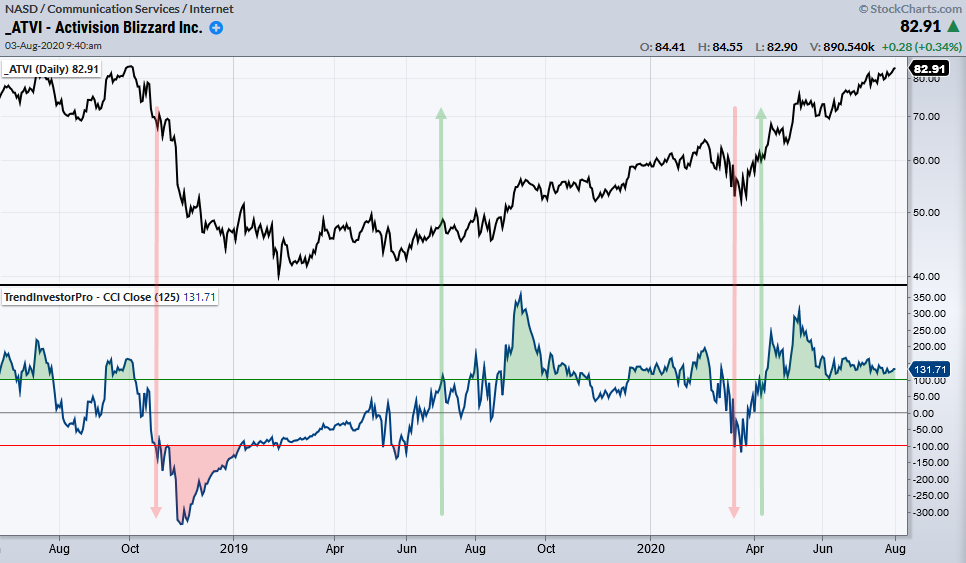
The example below shows Activision Blizzard (ATVI) with four trend-following signals using CCI Close (125). The bearish signal in mid-March 2020 resulted in a whipsaw because there was a bullish signal in early April. This was one of the first bullish trend signals off the March low and ATVI continued higher into July.
TIP Normalized ROC
TIP Normalized ROC is a momentum indicator that normalizes the absolute rate-of-change using the Average True Range (ATR). It can be used to identify overbought and oversold conditions, as well as outsized moves that can signal a trend reversal. Using 20 periods as the default, the 20-period absolute Rate-of-Change is divided by the 20-period ATR. This means values can be compared across securities.
By default, the Upper Ref is set at +3 and the Lower Ref at -3. The reference lines can be adjusted to help chartists determine overbought/oversold levels. Overbought and oversold readings, however, should be used in conjunction with other indicators for confirmation. Also keep in mind that overbought/oversold levels can differ depending on the security. Oversold for the Utilities SPDR (XLU) is likely to be different than oversold for the Technology SPDR (XLK), which is more volatile.
Chartists can also use Normalized ROC to spot sudden outsized moves in one direction or the other. Values above +3 or below -3 indicate that the absolute rate of change is more than three times the ATR value. This is an “outsized” move. After an extended price move in one direction and several outsized moves, an outsized move in the opposite direction can signal a trend reversal.
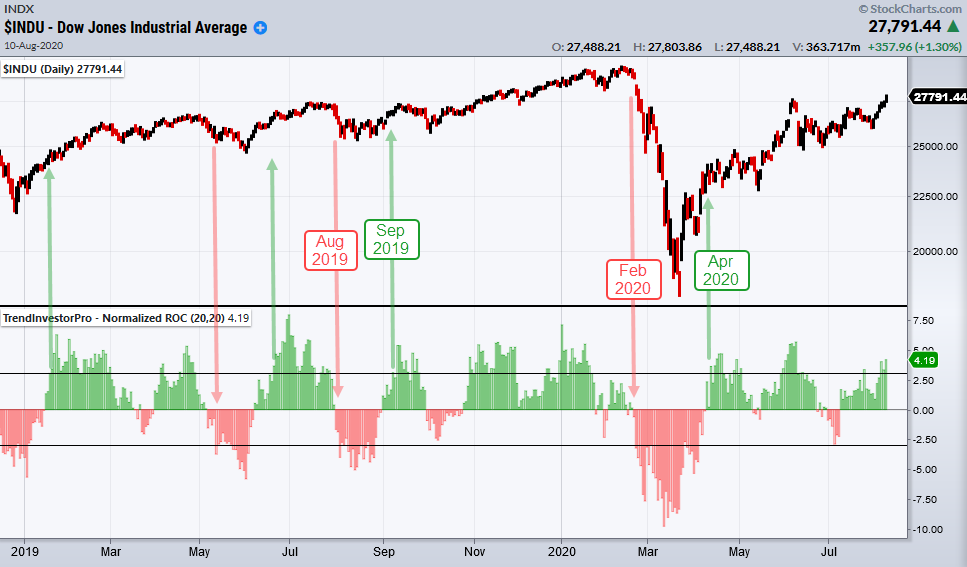
The example below shows the Dow Industrials with Normalized ROC (20,20). Notice how the Dow fell in August 2019 and Normalized ROC was below -3 most of the month. Normalized ROC then exceeded +3 on September 10th and an uptrend extended into February. There were no “outsized” declines during this period because Normalized ROC did not exceed -3. This uptrend reversed when Normalized ROC exceeded -3 for an outsized decline on February 24th. The subsequent downtrend reversed with a surge above +3 on April 15th.
TIP High Low Range Percent
TIP High Low Range Percent is a volatility indicator that quantifies the high-low range as a percentage of the closing price. This can be used to identify wide intraday price swings (volatility) and narrow price swings. Narrow range days show indecision that can sometimes lead to a reversal. Chartists can set the smoothing periods to 1 to see daily values.
The default setting is 10 periods for smoothing, which is a 10 period SMA of each period's High Low Range Percent. The Reference line is set at 1, but may require adjusting depending on the security. Bars are red when above the reference line and green when below. High or rising High Low Range Percent signals rising volatility and this is generally negative. Low or falling values signal low or falling volatility and this can be positive.
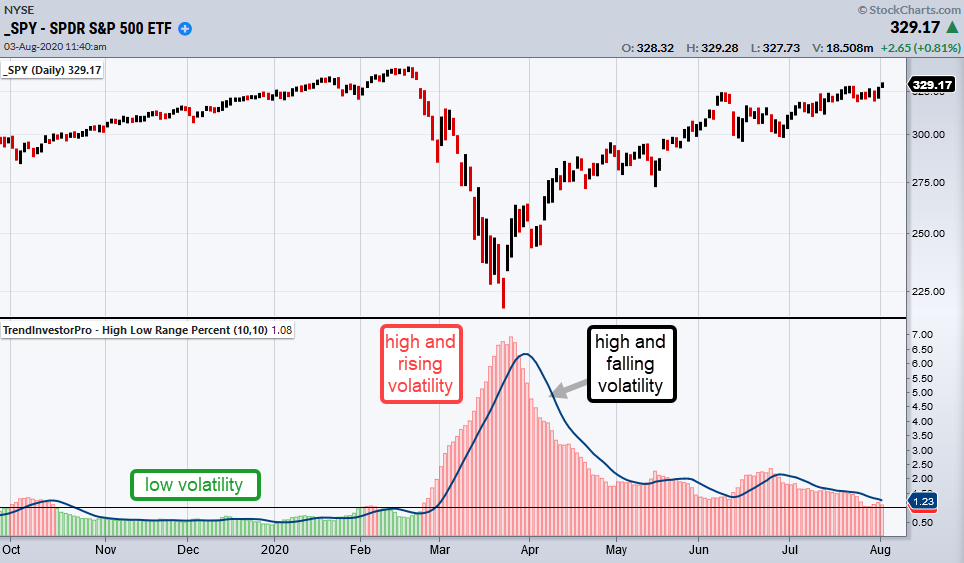
The example below shows the S&P 500 SPDR (_SPY) with High Low Range Percent smoothed with a 10-period SMA. The reference line is set at 1 to set the volatility threshold and the signal line is set at 10 to show upturns and downturns. The indicator held below 1 from mid-October to late January as SPY advanced (low volatility). Volatility shot higher in March and the indicator remained above its 10-day SMA until late March (high and rising). Volatility declined into early May and SPY moved higher. There is clearly an inverse relationship between volatility and price.
TIP Normalized ATR
TIP Normalized ATR is a volatility indicator that shows the Average True Range as a percentage of price. This normalizes ATR values so they can be compared across securities. Stocks, ETFs and indexes with higher values are deemed more volatile than those with lower values. For example, normalized ATR was around 1.71 for the Healthcare SPDR (XLV) in early August, but was around 2.42 for the Biotech ETF (IBB). IBB is more volatile (risky) than XLV.
Chartists can also use this indicator to identify periods when volatility is rising, falling, low or high. In general, rising and/or high volatility is associated with price declines, while falling and/or low volatility is associated with price advances.
The default setting is 20 for the ATR/SMA periods, which is the 20-period ATR divided by the 20-period SMA. There is an option for smoothing the indicator with a moving average and adding a Reference line. Values above the Reference line are red and values below the Reference line are green.
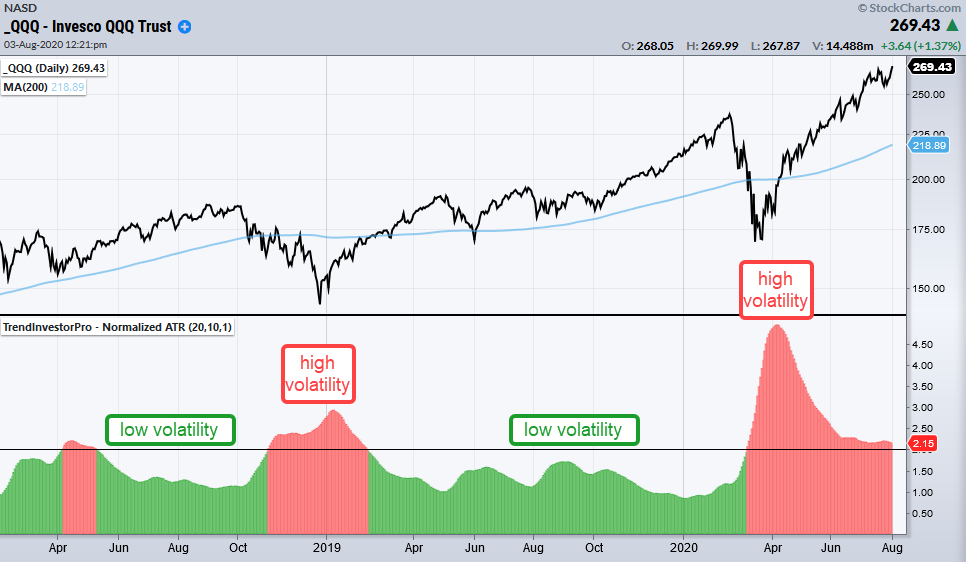
The example shows the Nasdaq 100 ETF (_QQQ) with Normalized ATR highlighting different volatility periods (green, red). Normalized ATR started rising in mid-October 2018 and exceeded 2 by month end (turned red). This coincided with a price decline below the 200-day SMA. Normalized ATR fell in early 2019 and moved below 2 in mid-February (turned green). This coincided with price moving back above the 200-day SMA.
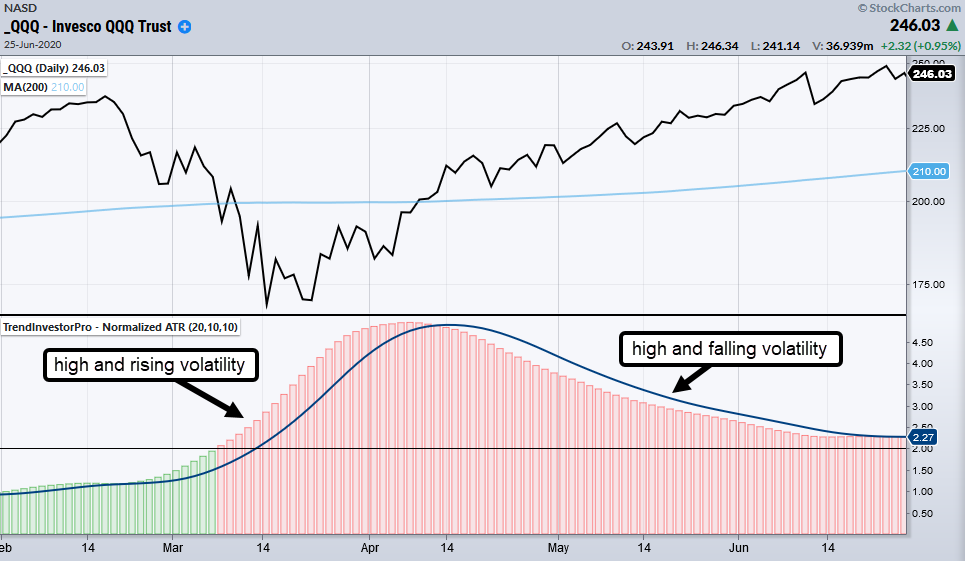
The second example below shows Normalized ATR turning up in late February 2020 and moving above 2 in early March. Price also moved below the 200-day SMA. Volatility rose until early April and then turned down as Normalized ATR moved below its 10-day SMA (blue line). Decreasing volatility facilitated the price advance from mid-April to mid-June.
TIP ATR Trailing Stop and TIP ATR Trailing Stop (SAR)
The ATR Trailing Stop is a stop-loss indicator that follows prices when they move in a favorable direction and triggers when there is an adverse price move. This indicator can be anchored immediately after a trade entry to set an initial stop-loss and control risk. Should prices move in a favorable direction, this indicator will trail price and provide traders with a mechanism to lock in profits.
The ATR Trailing Stop is placed a specified distance below the price plot for longs and above the price plot for shorts. This distance is based on the Average True Range (ATR) indicator and a multiplier. ATR is a volatility indicator developed by Welles Wilder, creator of RSI. As such, the ATR Trailing Stop dynamically adjusts to the volatility of the underlying price. The ATR Trailing Stop can also be plotted in stop and reverse (SAR) format like the Parabolic SAR.
Sylvain Vervoort developed the ATR Trailing Stop and featured it in Stocks & Commodities magazine in June 2009. The indicator, however, dates back to at least 2005 because this is when Vervoort first published an example on his website using Salesforce.com (CRM). This version is slightly different because it only ratchets higher (lower) when a new high (low) is recorded.
The ATR Trailing Stop (Long) is based on the Average True Range (ATR) value, an ATR multiplier and the highest “Calculated From” price since the anchor date. Chartists can set the anchor date by choosing the indicator, clicking on the price plot and then closing the indicator settings. The example below shows an ATR Trailing Stop (Long) with an anchor date starting on November 4th, which is when the Semiconductor ETF (SOXX) broke out.
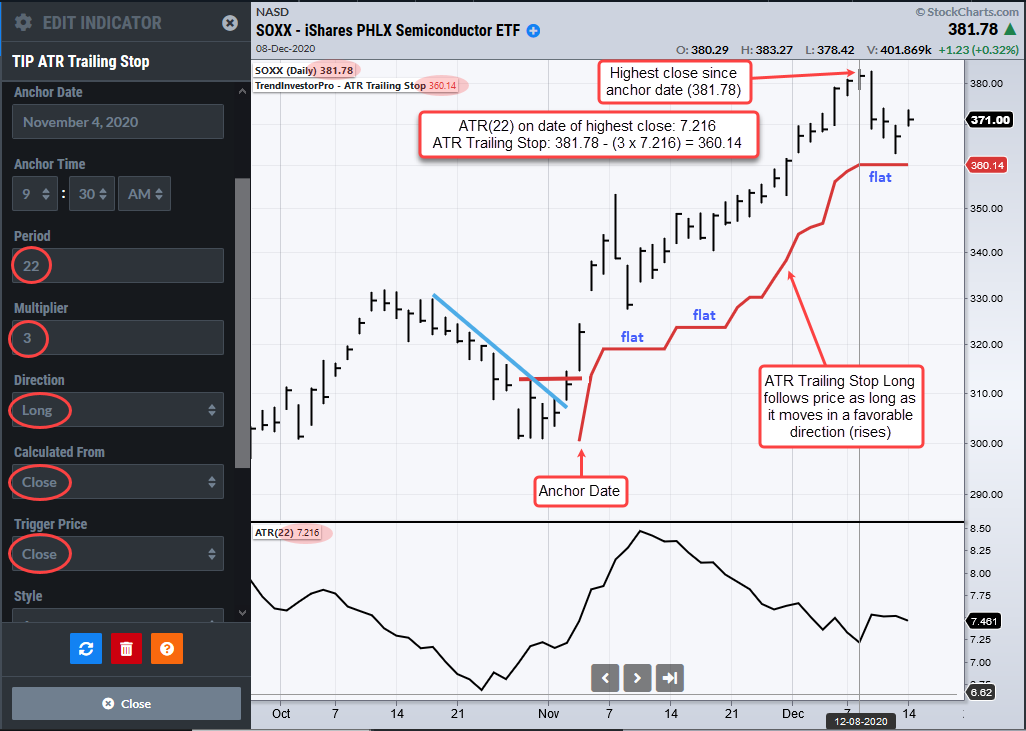
The ATR Trailing Stop is the highest “Calculated From” price since the anchor date less a multiple of the ATR value. In this example, the “Calculated From” price is the close, ATR is based on 22 periods (days) and the ATR multiplier is 3. Thus, the ATR Trailing Stop is three ATR(22) values below the highest close since the anchor date. Also note that the ATR value is based on the value at the time of the highest close and remains static until there is a higher close.
The ATR Trailing Stop rises as long as the “Calculated From” price (close) rises. In the example above, the ATR Trailing Stop alternates between rising and flat-lining. A flat ATR Trailing Stop means the close (Calculated From price) stopped rising and the ATR Trailing Stop did not change. The highest close is on December 8th and the ATR Trailing Stop flat-lined the last four bars.
The next example shows the ATR Trailing Stop with different settings: ATR Periods = 22, Multiplier = 3, Calculated From = Low and Trigger Price = Low. Of all variables, the multiplier has the biggest influence on the stop. A multiplier of 1 produces a relatively tight stop, while a multiplier of 5 results in a relatively wide stop. This is where judgement, trading preferences and experience come into play.
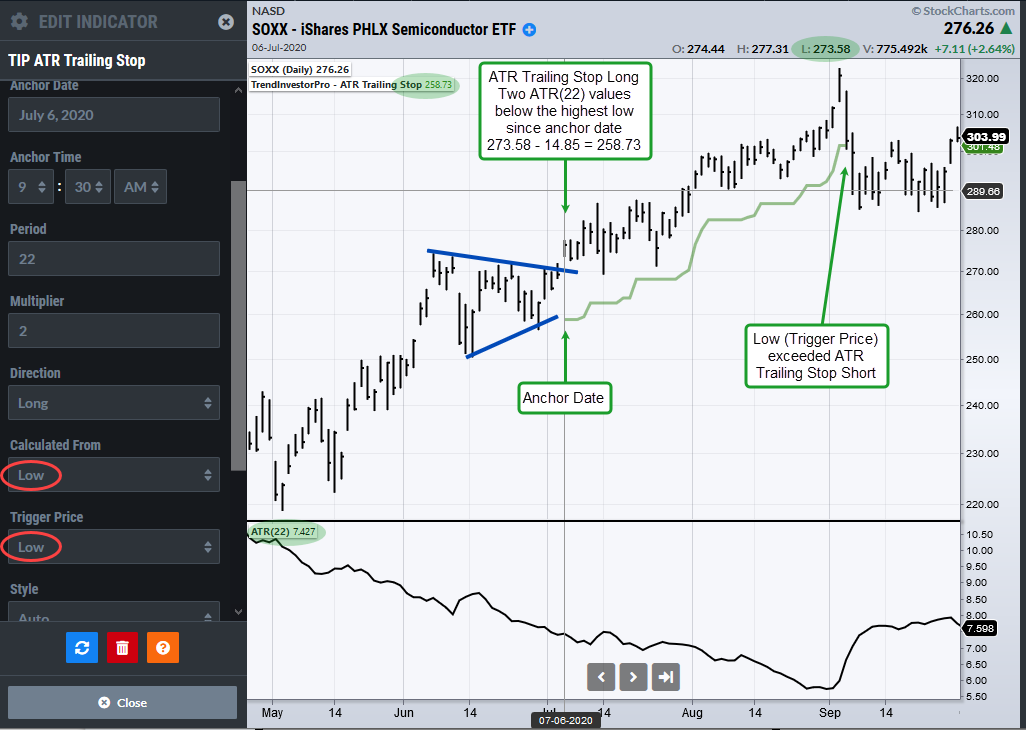
The Calculated From price also affects the stop. With long positions, a stop using the low as the Calculated From price will be wider than one that uses the close. In the example above, the lows in SOXX (Calculated From price) rose in July and August, and the ATR Trailing Stop rose. The Trigger Price was based on the low and the low on September 3rd was below the ATR Trailing Stop. Thus, the stop triggered and stopped plotting on the chart.
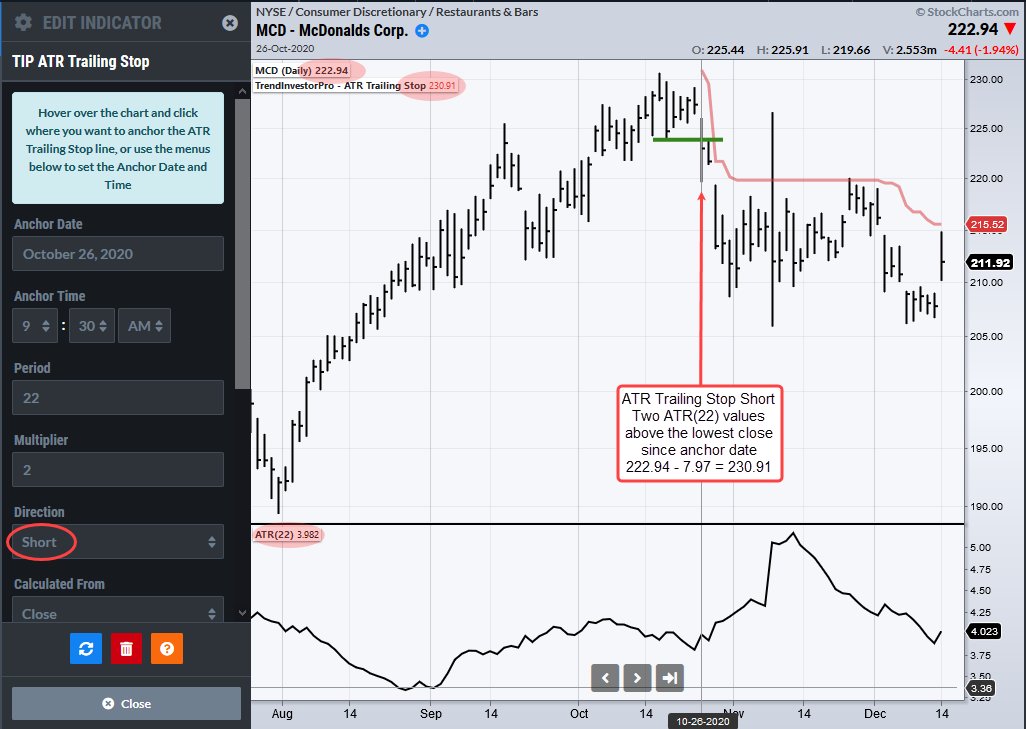
The next example shows the ATR Trailing Stop (Short) with an anchor date of October 26th. The initial stop-loss is just above the mid October high and trails lower as price falls. The Calculated From and Trigger Price are based on the close. Had the Trigger Price been based on the high, the stop would have triggered in November because the high exceeded the stop. The close did not exceed the stop and the stop did not trigger in this example.
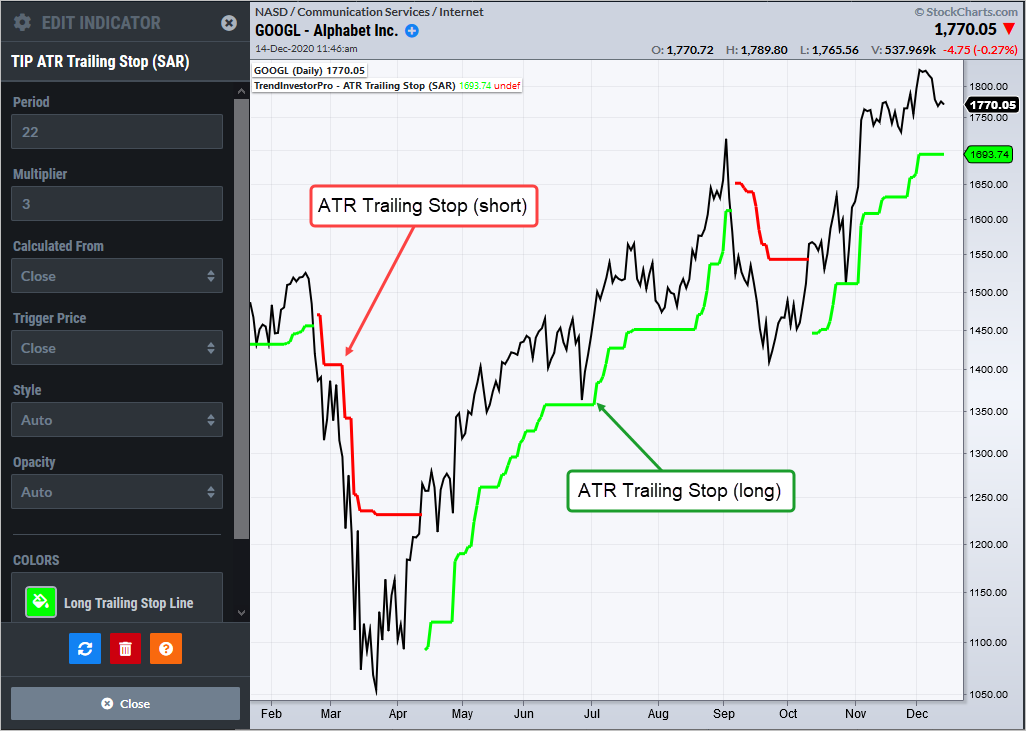
There is also a Stop and Reverse version called the ATR Trailing Stop (SAR). This version combines the long and short versions into one continuous indicator, similar to Parabolic SAR. The example below shows Alphabet (GOOGL) with the following settings: ATR Periods = 22, Multiplier = 3, Calculated From = Close and Trigger Price = Close.
The ATR Trailing Stop Short (red) starts when the ATR Trailing Stop Long (green) is triggered and visa versa. This method shows how a static trailing stop would have worked on both the long and short side over time. In reality, the settings for the trailing stop are more dynamic and not always uniform, especially for long and short positions. Nevertheless, the ATR Trailing Stop (SAR) can give traders and idea of how a specific setting works over a longer period of time.
On the ATR Trailing Stop settings, there are different options available for the Calculated From and Trigger Price. These include the (High-Low)/2, (High+Low+Close)/3 and (Open+High+Low+Close)/4. Personally, I prefer the close for both variables because this keeps its simple. Chartists interested in intraday price movements, can consider using the Low for Calculated From and Trigger Price variables with the ATR Trailing Stop Long. Similarly, the High can be used for these variables with ATR Trailing Stop Short.
The ATR Trailing Stop is a great compliment to a trading strategy because it gives us an objective and systematic means to exit a position. In other words, it takes the guess-work out when it comes to exits. As with all indicators, it is not perfect and chartists should thoroughly test drive before using. Find what works for you and use it accordingly.