Table of Contents
StockChartsACP Tutorial
We’re excited for you to explore this pre-release version of StockChartsACP, our new advanced, interactive charting platform. The full capabilities of ACP are still in development, but this preview will allow users to experience the next generation of StockCharts technology before the official product launch later this year.
Many more features and improvements to this demo version are yet to come, so don’t be alarmed if you notice anything missing. Also, rest assured that ACP will be offered alongside our traditional SharpCharts tool. The two are designed to complement each other. The SharpCharts you’ve always known and loved aren’t going anywhere!
Read on for instructions on how to use StockChartsACP to perform some common charting tasks.
Note: For best results, we recommend using the StockChartsACP tool with Chrome or Firefox.
Changing the Ticker Symbol
To change the ticker symbol for your chart, simply type in a new ticker in the “Symbol” box at the top of the page, then press Enter on your keyboard. A dropdown menu will then suggest possible symbols. StockChartsACP uses the same data and same ticker symbol conventions as SharpCharts and other StockCharts charting tools.
You can also use the stock selection tools on the right to find lists of ticker symbols to chart. For example, the chart icon in the top right shows Market Summary lists, the trophy icon shows SCTR lists, the bells icon shows predefined alert lists, and so on. Clicking on any of the stocks in these lists will change the chart to that symbol.
Scrolling
To move backward or forward inside the chart, click and hold the left mouse button while dragging the chart to left or right. Use the left and right arrow buttons at the bottom of the chart to scroll forward or backward one bar at a time. Clicking the icon with an arrow and a line will take you back to today's date.
Zooming In/Out
To zoom in on the chart for a more close-up view, use the scroll wheel of your mouse or the standard scrolling gestures on your trackpad/touchscreen. This removes bars from the left side of the chart, allowing the remaining bars to be larger. Scroll in the opposite direction to zoom back out again.
Note: If your chart is in Fit-to-Window mode, you will need press and hold the Ctrl key while scrolling in order to zoom in or out.
Changing the Type, Period and Range
Dropdown menus above the chart allow you to change the chart's type, period and range. We currently offer 8 chart types, including candlesticks and OHLC bars; more will be offered in the future. Several intraday, daily, weekly and monthly periods are available. Range controls the amount of data that is visible on the chart (similar to the range settings on SharpCharts).
Note that the period and range are tied together, if you choose a different period for your chart, then a “suitable” range will be chosen for the chart that is displayed, and vice versa. Once you've chosen the period you want, you can zoom in or out to adjust the range to meet your needs.
Note: Just like with SharpCharts, free users have access to fewer range and period options than StockCharts members have.
Changing the Chart Attributes
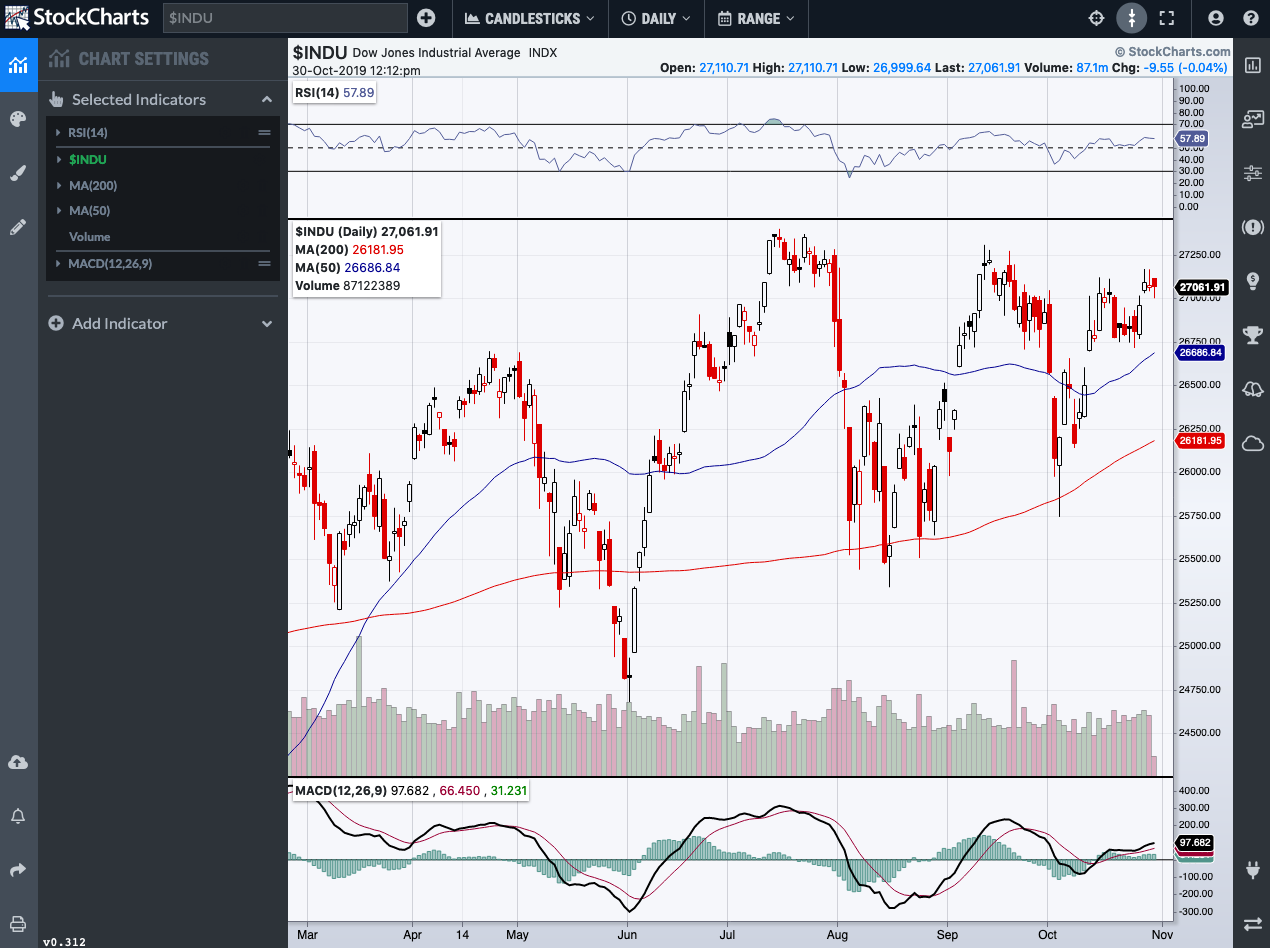
To change the attributes of your chart, hover your mouse over the green symbol name in the “Selected Indicators” section and click on the gears icon to the right of the name. This will launch a configuration window where you can change candlestick settings and chart scaling, plus control the display of legend, price, dividend, and split information on the chart.
Changing the Color Scheme
To change the color scheme of your chart, click on the artist palette icon on the left side of the page to expand the list of available color schemes. The list is grouped into dark, light, and specialty color schemes. Click the circle next to your desired scheme to update the chart with that color scheme.
To revert to the default color scheme, choose the Murphy color scheme in the Light Schemes section.
Changing the ChartStyle
We offer a number of built-in ChartStyles suitable for use with different strategies, timeframes, and trading styles, plus we offer the favorite ChartStyles of several of our analysts. To change the style of your chart, click on the paintbrush icon on the left side of the page to expand the list of available ChartStyles. The list is grouped into Strategies, Timeframes, Trading Styles, and Experts. Click the plus sign next to your desired ChartStyle to update the chart with that style.
To revert to the default ChartStyle, click the grey Reset button at the bottom of the ChartStyles list.
Adding an Indicator or Overlay
The bar chart icon on the left side of the page (directly below the StockCharts logo) shows the overlays and indicators currently in use on your chart.
To add another indicator or overlay to your chart, click to expand the “Add Indicator” menu, then click the plus sign next to your desired indicator or overlay to add it to your chart.
By default, indicators will be added to the bottom of the chart. To move the indicator panel to another location on the chart, find it in the “Selected Indicators” section to the left of the chart, then click and drag it to the desired location in the list.
Note: Just like with SharpCharts, free users will be limited to a maximum of 3 indicators and 3 overlays per chart.
Changing or Deleting an Indicator or Overlay
For quick access to the most commonly-used settings for an indicator or overlay, click the bar chart icon on the left of the page, then click the triangle to the left of the indicator name in the “Selected Indicators” section. Changes made to these settings take effect on the chart immediately.
To access the full settings configuration window for an indicator or overlay, hover your mouse over the indicator or overlay name in the “Selected Indicators” section and click on the gears icon to the right of the name. This will launch a configuration window where you can change the indicator's parameters, line colors, and more. Click the “Update” button when you've made your changes.
To delete the indicator, simply click the “Delete” button in this configuration window, or mouse over the indicator in the “Selected Indicators” section and click the trash can icon.
Note: You can also access the full configuration window by clicking on the indicator name in the indicator panel on the chart. For overlays, click on the overlay name in the chart's legend.
Using Crosshairs Mode
Similar to the SharpCharts Inspector, the crosshairs functionality allows you to see price and indicator values for each bar on the chart. Click the target icon at the top of the screen to turn on crosshairs mode, then mouse over the date in question. The OHLC values at the top of the screen will change as you mouse over different dates, as will the overlay values in the chart legend. When you mouse over a date in the indicator panel, the legend will display the indicator values for that date.
To revert to today's price and indicator values in the legend, simply click the target icon again to turn off crosshairs mode.
Using Fit-to-Window Mode
Fit-to-Window mode ensures that your entire chart is visible on the screen at one time, without the need for scrolling. When this mode is disabled, the height of your chart can extend beyond the browser window to give your indicators more vertical space; you can scroll to move the chart up or down in the browser window.
By default, Fit-to-Window mode is enabled. Click the Fit-to-Window icon (the one with two arrows pointing to each other) located at the top of the screen to disable or enable this mode.
Annotating Your Chart
To add annotations to your chart, click on the pencil icon on the left side of the page. This will expand the list of available annotations, grouped into line, text, shape, and line studies tools. Then, click the circle next to your desired annotation tool (the trendline tool is selected by default).
To draw a trendline, first click and hold on the point where you want the trendline to start, then drag the mouse to the point where you want the trendline to end. Release the mouse button to complete the annotation.
When you mouse over an existing trendline, circles will appear at each of its ends; click and drag one of those circles to reposition that end of the trendline. To delete an annotation, mouse over the annotation and right-click.
Adding More Chart Panels
By default, only one chart is displayed in the StockChartsACP tool, but currently, up to 9 chart panels can be displayed at once. Simply click the “plus” icon at the top of the page to add another chart panel. By default, the new chart panel will use the same symbol as the current chart, but there are a number of ways you can easily add a new panel with a different symbol:
- Type the desired ticker in the “Symbol” box at the top of the chart, then click the “plus” icon.
- Type the desired ticker in the “Symbol” box at the top of the chart, then hold down the Shift key on your keyboard and press the Enter key.
- Hold down the Shift key while clicking on one of the symbols in the lists of stocks in the right panel.
To edit a chart on a specific panel, click on the panel and ensure that it has a light blue outline around it. Then, make your changes as usual (including changing the symbol, adding indicators, etc.); those changes will be made only on the selected chart panel.
To delete a panel, mouse over the chart in question, then click on the “X” icon in the upper right corner of the chart panel.
Note: Only StockCharts members can add chart panels in ACP. Free users will be limited to one chart panel.
More Features to Come
Remember, this is a pre-release version of the StockChartsACP tool, so some features are not yet fully operational (including the Save, Share and Print icons on the bottom left of the screen), but we're adding more functionality every day. Be sure to check back often to see all the latest features.