Table of Contents
Performance View
Performance view allows you to see performance history information for all the charts in your ChartList at once. This view is especially useful for watchlists, as it shows you price performance information across multiple timeframes for each of the ticker symbols used in your ChartList at a glance. In addition, you can specify a benchmark symbol to compare relative strength and weakness across different timeframes.
Accessing the Performance View
From Your Dashboard, you can select “Performance” from the “View As” dropdown next to the ChartList you wish to view. Alternately, you can switch to Performance format from other ChartList formats, such as ChartBook, GalleryView or CandleGlance by selecting “Performance” from the “View List As” dropdown.
Using the Performance View
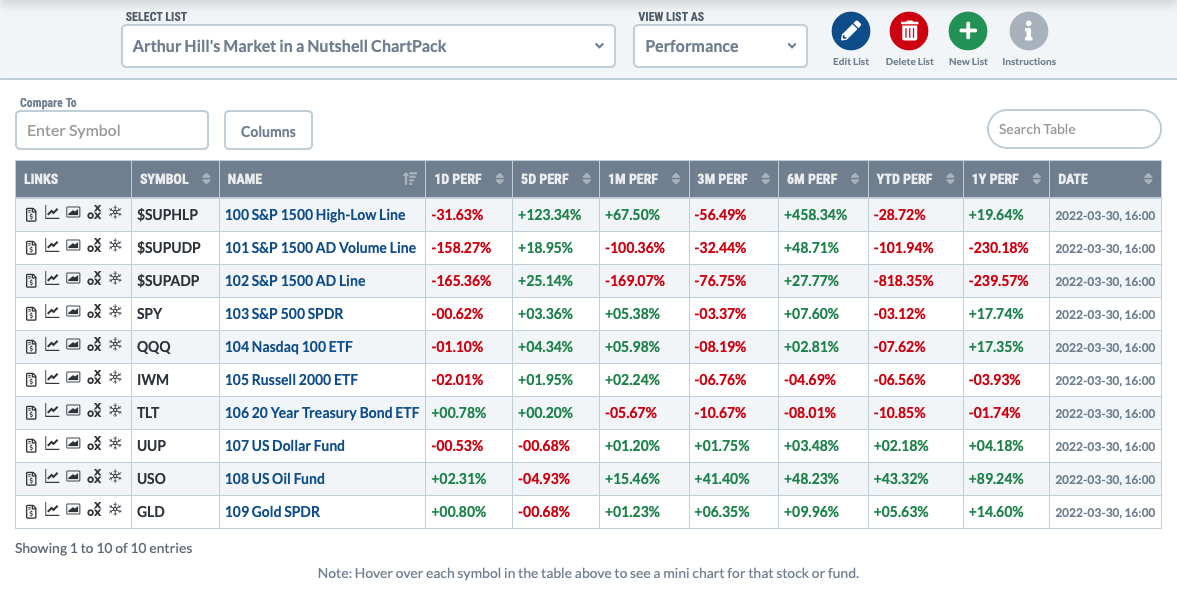
At the top of the page, you can use the “Select List” dropdown to choose a different ChartList to display.
The performance table has one line for each chart in your ChartList. In addition to the chart's title, the table shows the ticker symbol and performance data for the main ticker symbol used in the chart across multiple timeframes: 1 day, 5 days, 1 month, 3 months, 6 months, year-to-date, and 1 year.
The performance columns show the percent price change for the symbol over the specified timeframe. If a benchmark symbol is entered in the Compare To field above the table, then the performance columns show relative price performance compared to the benchmark.
Hover over a ticker symbol to display a mini chart for that symbol. This is a great way to quickly preview multiple stocks on the list without ever leaving the Performance View page.
Click the appropriate icon in the left column of each row in order to display the symbol in a full-scale SharpChart, GalleryView, Point & Figure or Seasonality chart. Clicking on the chart title itself will display the chart in the workbench with all its annotations.
To view the entire ChartList in a different format, such as CandleGlance or Seasonality view, use the “View List As” dropdown above the chart to make a new selection.
Customizing the Performance View
Initially, the performance columns show the percent price change for the symbol over the specified timeframe. To compare price performance to a benchmark, enter the benchmark symbol in the Compare To field above the table. The performance columns will be updated to show percent price change for the ratio between the ChartList symbol and the benchmark symbol.
The Performance view also has the same functionality as most of the tables on our site:
- Click the Columns button at the top to show or hide columns in the list.
- To sort by a different column, click the double-arrow icon next to the column header.
- To sort by multiple columns (e.g. sort by column A, and within each value for A, sort by column B), click the first column, then hold down the shift key while selecting the second column.
- Search the items in the list by typing in the Search Table box at the top right.
Editing the ChartList
You can add or edit notes for the entire ChartList by clicking in the ChartList Notes box at the bottom of the screen. Click the “Save” button once you've made your changes. For more editing functionality, use the “Edit List” button at the top of the screen to load the ChartList in Edit View.
The “Delete List” and “New List” buttons can be used to delete the current ChartList and create a new ChartList, respectively.