Table of Contents
Summary View
Summary view allows you to see summary information for all the charts in your ChartList at once. This view is especially useful for watchlists, as it shows you basic performance information for each of the ticker symbols used in your ChartList at a glance.
Accessing the Summary View
From Your Dashboard, you can select “Summary” from the “View As” dropdown next to the ChartList you wish to view. Alternately, you can switch to Summary format from other ChartList formats, such as ChartBook, GalleryView or CandleGlance by selecting “Summary” from the “View List As” dropdown.
Using the Summary View
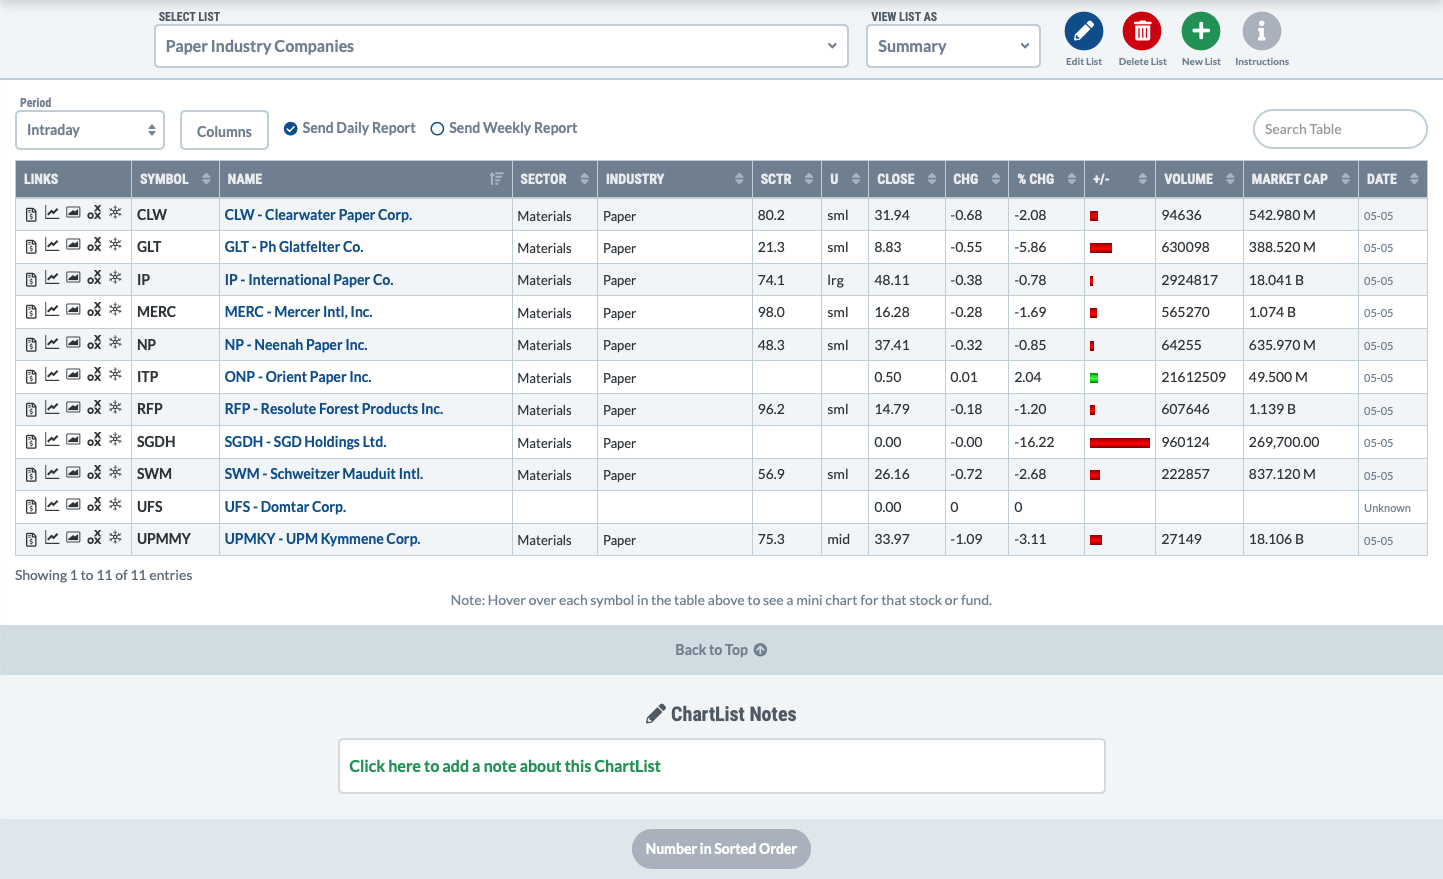
At the top of the page, you can use the “Select List” dropdown to choose a different ChartList to display.
The summary table has one line for each chart in your ChartList. In addition to the chart's title, the table shows the ticker symbol, sector and industry, SCTR value, market cap, price and volume information for the main ticker symbol used in the chart.
The view can be configured to show optional additional columns of technical and fundamental data for each symbol, including EMAs, SMAs, RSI, ATR, ADX, EPS, P/E, and earnings date information. Simply click the Columns button at the top, then choose the columns to show or hide in the table.
Hover over a ticker symbol to display a mini chart for that symbol. This is a great way to quickly preview multiple stocks on the list without ever leaving the Summary View page.
Click the appropriate icon in the left column of each row in order to display the symbol in a full-scale SharpChart, GalleryView, Point & Figure or Seasonality chart. Clicking on the chart title itself will display the chart in the workbench with all its annotations.
To view the entire ChartList in a different format, such as CandleGlance or Seasonality view, use the “View List As” dropdown above the chart to make a new selection.
Setting Up ChartList Reports
ChartList Reports are a great way to monitor your ChartLists. Once you turn on ChartList Reports for one of your lists using the Send Daily Report and Send Weekly Report checkboxes at the top of the Summary View, you'll receive daily and/or weekly performance summaries of all the securities on that list in your email inbox. These reports can be used to monitor your portfolio(s), track your own unique set of market indexes, follow specific groups like the Dow Industries, and more.
For more information on setting up ChartList Reports for your own lists, please see our ChartList Reports article in the Support Center.
Customizing the Summary View
Initially, the Summary View shows intraday data. You can use the Period dropdown above the chart to display performance data for the symbols over a different time period, ranging from one day to one year.
The Summary view also has the same functionality as most of the tables on our site:
- Click the Columns button at the top to show or hide columns in the list.
- To sort by a different column, click the double-arrow icon next to the column header.
- To sort by multiple columns (e.g. sort by column A, and within each value for A, sort by column B), click the first column, then hold down the shift key while selecting the second column.
- Search the items in the list by typing in the Search Table box at the top right.
Editing the ChartList
While Edit View provides the most comprehensive set of editing tools for your ChartList, some editing can be done directly from the Summary view:
- To permanently reorder the charts in the ChartList, sort the table in the order you want and click the “Number in Sorted Order” button at the bottom of the page. This will prepend a series of numbers to each chart title so the charts retain this order even in other ChartList views.
- You can add or edit notes for the entire ChartList by clicking in the ChartList Notes box at the bottom of the screen. Click the Save button once you've made your changes.
For more editing functionality, use the “Edit List” button at the top of the screen to load the ChartList in Edit View.
The “Delete List” and “New List” buttons can be used to delete the current ChartList and create a new ChartList, respectively.