This is an old revision of the document!
Table of Contents
Data and Ticker Symbols
Underlying all of the tools on StockCharts.com is our extensive price database, which contains data for over 50,000 different ticker symbols. After each trading day, over 1 million new data items are added to the database. It is important to understand how this data is organized in order to take full advantage of our website.
Markets We Cover
Currently, StockCharts has access to data from the following markets:
- New York Stock Exchange (US)
- Nasdaq Stock Exchange (US)
- Amex Stock Exchange (US)
- BATS Exchange (US)
- TSX Stock Exchange (Canada)
- TSX-Venture Stock Exchange (Canada)
- Canadian Securities Exchange (Canada)
- London Stock Exchange (UK)
- National Stock Exchange of India (India)
We have datasets for most ticker symbols in each of the markets we cover, but that doesn't necessarily mean we have all ticker symbols. We do not automatically provide data for extremely low-priced stocks since technical analysis techniques do not work with such stocks and the charts for those stocks can be extremely misleading.
If there is a ticker symbol for a stock in a market we cover that you would like to see and we do not have that symbol in our database, you can request that we add that symbol by using our Symbol Request Form.
Other Financial Data
In addition to securities data from the markets listed above, StockCharts offers data for a wide range of indexes, market breadth indicators, economic indicators, cryptocurrencies, currencies, commodities, and futures. Details of those offerings can be found in our Index Catalog.
If you'd like to chart your own data, our User-Defined Index feature allows you to create and chart your own symbols.
Learn More: Index Catalog | User-Defined Indexes
Real-Time Data
We offer real-time data from two different sources: exchange real-time data for NYSE/Nasdaq/TSX/LSE/NSE and BATS real-time data for NYSE/Nasdaq.
Exchange real-time data comes directly from the appropriate exchange. We consider data quotes from those exchanges to be the “official” quotes for each security, and they should be extremely close to real-time values found on other sources. In addition, exchange real-time data contains accurate volume data. We highlight exchange real-time data bars in green.
We currently offer exchange real-time data for the NYSE, Nasdaq, TSX, LSE and NSE exchanges. There is an additional charge from the exchanges for their real-time data.
BATS real-time data is provided by the BATS exchange for no additional charge. BATS data is only available for US stocks. For liquid stocks, BATS data is very similar to NYSE/Nasdaq data. For thinly-traded stocks, BATS data can differ significantly. BATS data quotes do not contain useful volume information, so we do not display volume on BATS charts. We highlight BATS real-time data bars in yellow. Click here for more information about the BATS real-time data available on our site.
Data Bar Periods
For each ticker symbol in our database, we have daily, weekly and monthly data bars. For the stocks that we track, we also have intraday data bars available in 1-, 2-, 3-, 5-, 10-, 15-, 30-, 60- and 120-minute durations.
Subscribers can create charts using any of the time periods listed above. Non-members can only chart daily and weekly bars.
Mutual Funds only report one data point per day (after the market closes) and thus can only be charted as lines on daily charts.
Indexes that only have one data value per day are called “End-of-Day” indexes and have the phrase “(EOD)” at the end of their description. They are typically updated soon after the market closes. Indexes that have the phrase “(NBD)” are updated during the next business day (i.e., the next day that the market is open).
Data for 1-minute, 10-minute, 60-minute and daily periods is pulled directly from our data feed. “Longer” bars are created by combining the appropriate shorter time-period bars together. For instance, the bars used on weekly charts are created from daily data using the following technique:
- Weekly Open = Open of the first daily bar for the given week (typically Monday's open)
- Weekly High = Highest high for all the daily bars for that week
- Weekly Low = Lowest low for all the daily bars for that week
- Weekly Close = Close value for the last daily bar for that week (typically Friday's close)
Similar techniques are used to create 5-minute bars from 1-minute data, 30-minute bars from 10-minute data, monthly bars from daily data, etc.
Note: The date for weekly and monthly bars indicates the start of the bar's time period. For example, on a weekly bar, the date of the bar corresponds to the Monday of that week.
Note: For intraday bars, the first bar of the day may be shorter than the others. For example, since the US and Canada markets open at 9:30 AM, the first hourly bar of the day actually only covers 30 minutes, from 9:30 AM to 10:00 AM. Subsequent bars cover entire hours.
Adjusted vs. Non-Adjusted Data
We adjust our historical price data to remove the effects of fund distributions, dividends and stock splits from our charts. Without those adjustments, our technical indicators would give false signals.
If you'd like to chart the non-adjusted version of a stock, just add an underscore character to the front of the stock's ticker symbol.
Click here for more details on data adjustments.
Historical Data Availability
The availability of historical data on our site varies based on the specific symbol, the data bar period, your membership level and how you want to use the data.
By Data Bar Period
Our database has:
- 1-, 2-, 3-, 5- and 15-minute bars going back 20 days.
- 10- and 30-minute bars going back 40 days.
- 60-minute bars going back to 2004.
- Daily, weekly and monthly bars going back to 1990 for most stocks, indexes and mutual funds (assuming they have been around that long).
- Daily, weekly and monthly bars going back as far as 1900 for some indexes.
By Service Level
Your membership service level will determine how much historical data you can use in your charts, as well as whether or not you can see historical data in tabular format.
- Non-members can only create charts of 5-years or less in length. They cannot see data in tabular format.
- Basic and Extra members can create charts that use data from as far back as 1980. They can also see data in tabular form going back to 1990.
- PRO members can use all of our historical data in their charts with some data going back to the 1940s or earlier. PRO members can see data in tabular form going back to 1970.
By Ticker Symbol
To see exactly how far back we have data for a particular symbol, just click the Symbol Catalog link at the bottom of any of our pages and search for the ticker symbol you are interested in. The starting date for its data is listed on the right side of the search results.
Ticker Symbol Conventions
We use the following conventions with our ticker symbols:
- US stocks have symbols that consist of letters without any other symbols - such symbols indicate that that stock is listed on either the NYSE, Nasdaq or Amex Exchanges
- TSX-listed stocks have symbols that end with “.TO”
- TSX Venture-listed stocks have symbols that end with “.V”
- London-listed stocks have symbols that end with “.L”
- Indian-listed stocks have symbols that end with “.IN”
- Different stock classes are indicated with a forward slash (“/”) and one or more letters, e.g. BRK/A, RBN/UN.TO
- Unadjusted stock datasets have symbols that start with an underscore (“_”). Click here for details on data adjustments
- Indexes and market indicators (i.e. non-trading datasets that do not contain price information) start with either a “$” or a “!” character
- Economic Indexes start with “$$”
- End-of-day Futures symbols start with “^”
- If two ticker symbols are joined together with a colon character, it represents the ratio of those two datasets, e.g. IBM:$SPX (see below)
- If two ticker symbols are joined together with a hyphen, it represents the difference of those two datasets (see below)
- Adding a hyphen before a single ticker symbol will show an inverse chart for that symbol (or use the $ONE pseudo-symbol as outlined below)
- User-Defined Indexes that have not been shared with others start with an “@” symbol (see below)
- User-Defined Indexes that have been shared publicly currently start with “!” (see below)
Note: Currently, “!” indexes are mostly indexes that were originally posted on the defunct DecisionPoint website, while “$” indexes were originally posted on StockCharts.com.
Step-by-Step Instructions: How to Find a Ticker Symbol
Ratio Symbols (Relative Strength)
Often, it can be useful to study the ratio of two datasets in order to determine things like the relative strength of a stock when compared to an index. StockCharts users can create ratios from any two ticker symbols in our entire database. Anywhere on our website that a single ticker symbol can be entered, you can also enter two symbols joined together with a colon character (“:”) and we will use the ratio of those two symbols. We call such a combination of symbols a “Ratio Symbol.”
Here is an example of a ratio symbol in use:
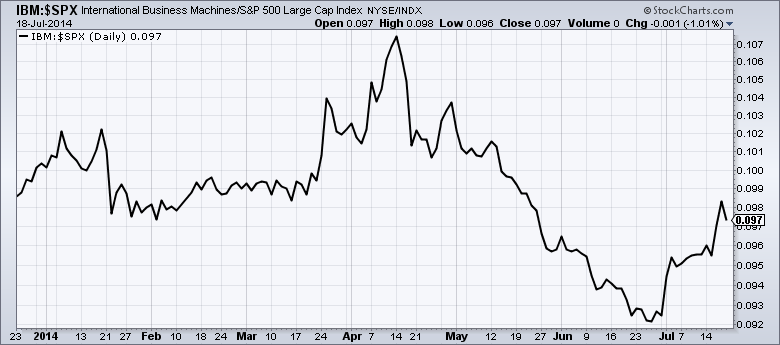
People can use ratio symbols to create what is sometimes called the “Price Relative line,” the ratio of a stock against the S&P 500 Large Cap Index. For example, charting AAPL:$SPX will show you the Price Relative line for Apple Inc.
Ratio symbols are also used to create what are called “Relative Strength” charts, which plot the ratio of two ticker symbols on a line chart. The following rules are used to interpret a relative strength chart:
- The actual values for each point on the relative strength line is not relevant. Instead, focus on the direction and shape of the line.
- If the line is rising, the first ticker symbol is outperforming the second ticker symbol.
- If the line is falling, the second ticker symbol is outperforming the first.
On a SharpChart, the “Price” indicator can be used to add a ratio symbol to an existing chart.
Calculation:
For purposes of consistency and data integrity, we use the following formulas when calculating a ratio symbol:
- Open = Open of the first symbol / Close of the second symbol
- High = High of the first symbol / Close of the second symbol
- Low = Low of the first symbol / Close of the second symbol
- Close = Close of the first symbol / Close of the second symbol
- Volume = Volume of the first symbol / Volume of the second symbol
These formulas ensure that the ratio symbol's High value is still the highest value and its Low value is still the lowest value in the resulting dataset.
Difference Symbols
Similar to ratio symbols (see above), you can also join two ticker symbols together with a hyphen to create a “Difference Symbol,” e.g. $TYX-$FVX.
On a SharpChart, the “Price” indicator can be used to add a Difference Symbol to an existing chart.
Calculation:
The Open, High, Low, Close and Volume values for the second symbol are subtracted from the corresponding values of the first symbol.
Pseudo-Symbols
There are several ticker symbols that we recognize that do not represent actual data in our database. Instead, these symbols contain data that is useful in very specific contexts. We call these ticker symbols “Pseudo-Symbols.” One prominent pseudo-symbol we have is:
- $ONE - this index always contains the value “1” for all of its data fields. It is mainly used to generate the reciprocal of any other ticker symbol in our database by using it in the first position of a Ratio Symbol - e.g., $ONE:$VIX. This is one easy way to create an inverse chart.
We have three symbols that are useful in creating ChartStyles that focus on relative strength:
- $SYMBOL - this index equals the “main” ticker symbol in a SharpChart.
- $SECTOR - this index equals the sector ETF of the sector that the main ticker symbol belongs to.
- $INDUSTRY - this index equals the industry index for the industry that the main ticker symbol belongs to.
So, for example, you could use these symbols to create a ChartStyle with a “Price” Indicator of “$SYMBOL:SECTOR” - then, regardless of the ticker symbol you apply the style to, we would then plot a sector-based relative strength line on the chart. These pseudo-symbols are available for use with US symbols that have a sector and industry assigned to them.
We also have several “theoretical” pattern symbols that contain “perfect” versions of different price patterns for use in studying the behavior of technical indicators when such patterns appear on a chart. All such symbols have “$TH” at their start, as seen below:
- $THSAW - This index contains a “perfect” sawtooth pattern for studying 45-degree reversals.
- $THSINE - This index contains a “perfect” sine-wave pattern for studying rounded reversals.
- $THHS - This index contains “perfect” head-and-shoulders reversal patterns.
- $THEW - This index contains “perfect” Elliott Wave patterns.
- $THSS - This index contains a “perfect” set of sawtooth wave patterns that are themselves contained in a larger period sawtooth pattern.
Additional Resources
Videos
Articles
- StockCharts Historical Sector Data - learn how StockCharts provides historical data for analysis of the Real Estate and Communication Services sectors.
Frequently Asked Questions
Q: Do you offer pre-market or after hours data?
A: We do not have access to such data at this time.
Q: What time do the NSE charts update in real time?
A: The NSE starts trading at 9:15 AM and closes at 4:00 PM local time. That would be 11:45 PM and 6:30 AM Eastern Time, respectively.
Next Up » User-Defined Indexes