Table of Contents
User-Defined Indexes
What Are User-Defined Indexes (UDIs)?
User-Defined Indexes (“UDIs” for short) are daily datasets you, instead of the StockCharts data team, can create and maintain. Extra and Pro service StockCharts members can store daily time-series data inside a UDI and use the SharpCharts charting tool to create charts of that data.
Examples of data that you might want to store in a UDI include:
- Stock prices for stocks that we do not cover
- Stock prices that you have edited
- Portfolio value over time
- Net worth over time
- A custom technical indicator calculated by a 3rd-party program
- The price of anything-you-can-think-of over time
- Your weight over time
- The possibilities are endless!
Extra members can create one User-Defined Index with “@MYINDEX” as its fixed ticker symbol. Pro members can create up to 30 different User-Defined Indexes and can give each index its unique ticker symbol.
User-Defined indexes can store daily, weekly, monthly, quarterly or yearly data, but cannot store intraday data. Note that only dates from 01/01/1900 onward can be stored.
The UDI Workbench
The UDI Workbench is the place to create, edit and delete your UDIs. The workbench allows you to enter a long and short description of your index and, for Pro users, pick the ticker symbol. From the workbench, you can either enter or upload the daily data for your index. You also have the ability to erase one row or all of the data in your index.
To access the UDI Workbench, go to Your Dashboard and click on the link for “User-Defined Indexes” located in the “Member Tools” area of the page.
Creating and Modifying UDIs
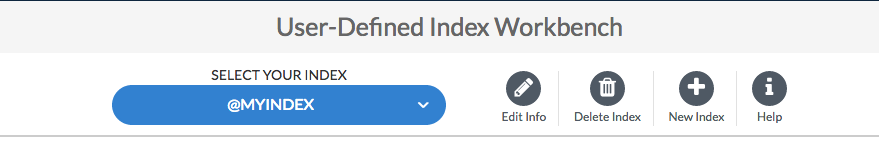
On the UDI Workbench, Extra members will see that they already have their one UDI created, with the ticker symbol “@MYINDEX.”
Pro users will need to add UDIs manually. To create a UDI, click the “New Index” button, enter the ticker symbol and long and short descriptions of your new UDI and, finally, click “Create Index.”
To work with a different one of your UDIs, click on the blue “Select Your Index” dropdown menu and choose a different index.
To edit the long or short descriptions for the currently-selected UDI, click on the “Edit Info” button. Make your changes and click the green “Save Changes” button.
In the event you no longer need one of your UDIs, you can click the “Delete Index” button to remove the currently-selected UDI.
Adding Data to Your UDI
After you've set up your UDI, you'll want to add data, which you can do either manually one row at a time or by uploading several rows using a specially-formatted spreadsheet.
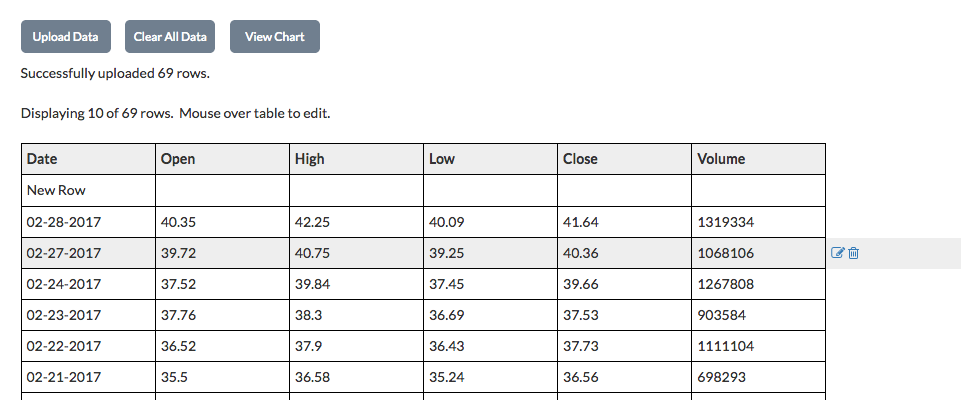
To add an individual row, click anywhere in the row of the data table that says “New Row” and fill in the information for that data point:
- Enter the Date in the format mm-dd-yyyy.
- You can either enter just the Close value or all four values (Open, High, Low and Close). These four fields should contain numbers with up to 4 decimal places.
- Volume is an optional field. If you fill it in, it should be a positive integer between 0 and 99,999,999.
Once the appropriate fields are filled in, click the “Save” button to add the new row.
Uploading Data from a Spreadsheet
If you have many rows of data to enter, you can save time by creating a spreadsheet on your computer and uploading all the data at once.
The spreadsheet must be formatted a certain way in order to be uploaded into your UDI:
- Column A should have the date, in the format mm-dd-yyyy (or mm/dd/yyyy). This column is required.
- Column B, C, D and E hold the Open, High, Low and Close values, respectively. These should contain numbers with up to 4 decimal places. Either fill all four columns or have only the Close value in Column E. If the value is blank for a column, you can just enter 0.
- Column F is an optional column holding the volume. If you enter a volume, it should be a positive integer between 0 and 99,999,999.
- The spreadsheet must be saved as a CSV file.
Once your spreadsheet is ready, click the “Upload Data” button on the UDI Workbench. Next, click “Choose File” and locate the CSV file on your computer. Lastly, click “Upload.”
Modifying Data in Your UDI
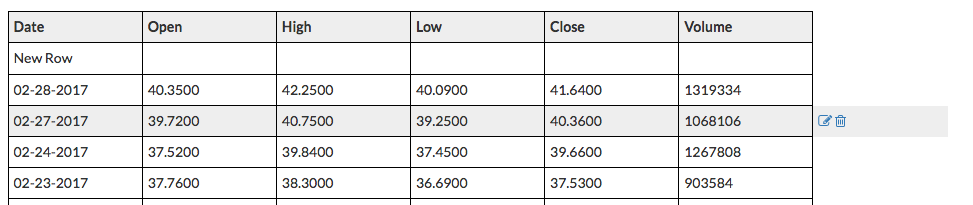
To edit an existing row, mouse over the row you want to change. Two small icons will appear to the right of the row. Clicking the pen and paper icon will allow you to edit the row. Click “Save” once you have made your changes.
To delete a single existing row, mouse over the row you want to change and click the trash can icon to the right of the row. To delete all the rows in your User-Defined Index, click the “Clear All Data” button above the table.
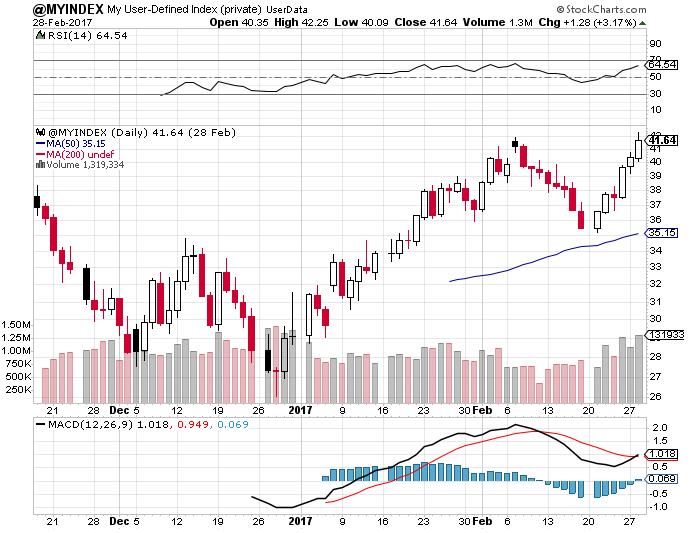
Charting Your UDI
Once you have data in your User-Defined Index, you'll want to chart that data. You can click the “View Chart” button on the UDI Workbench to launch a SharpChart of your UDI ticker symbol.
You can also add your UDI to any chart using the ticker symbol “@MYINDEX” (or for Pro users, whatever ticker symbol you specified for the UDI when you created it).