This is an old revision of the document!
How do I add an overlay to an indicator?
All StockCharts members have the ability to chart overlays of indicators. (This option is not available for non-members' charts.) If the “Advanced Options” area isn't visible, click the green triangle icon to make it appear. First, use the “Overlay” dropdown to select the overlay that you are interested in and modify any parameters if necessary. Afterwards, click the “Update” button.
To illustrate how this is done, here is an example of how to add a Simple Moving Average to the Price Indicator:
- Select the “Price” indicator from the drop-down menu. For this example, we have chosen $SPX as the parameter.
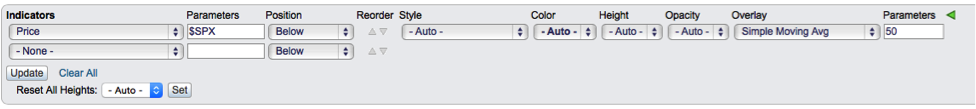
- Next, select “Simple Moving Average” from the Overlay dropdown in the “Advanced Options”. If the overlay has parameters, they will automatically populate with the “default” parameters for that overlay; however, you can customize them with your preferences. In this case, we left the parameters with the default of 50 days.
- Click “Update”.
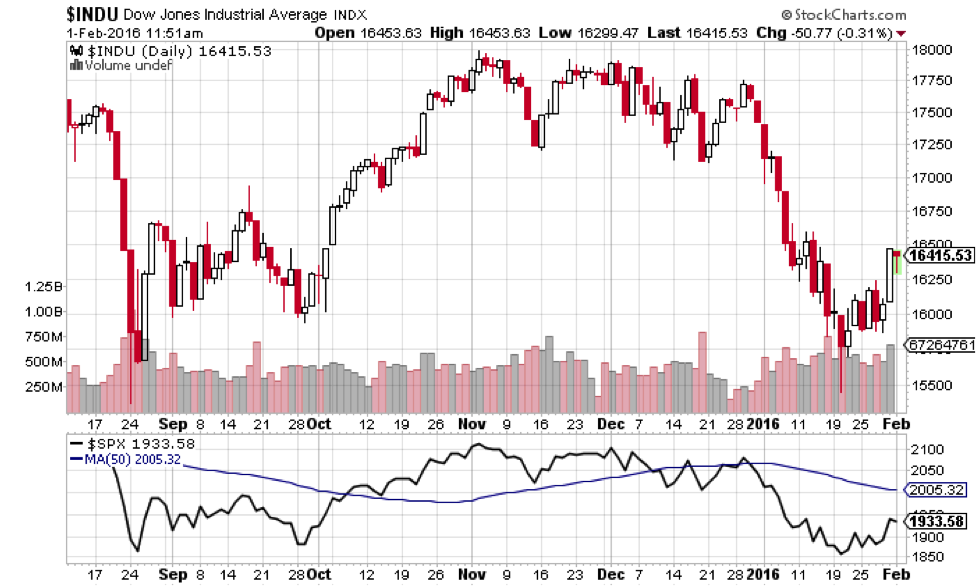
Here's what the finished chart should look like: