This is an old revision of the document!
Table of Contents
How do I add comments to a chart?
Having the ability to add comments to a chart is a great way for you to point out key items you wish to remember. In this tutorial, you will find step-by-step instructions for adding comments onto a chart directly using the ChartNotes Annotation tools, as well as adding comments about a chart using 10 Per Page View or Edit View.
10 Per Page View
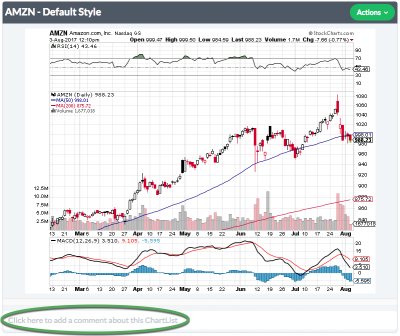
One way to add comments about a chart is to use the 10 Per Page View. When looking at charts in this view, you will notice a text box located below the chart that says “Click here to add a comment about this ChartList”. Click in the box. You can now add your comments regarding the chart. Once you're finished, click the green “Save” button to add your comments.
Edit View
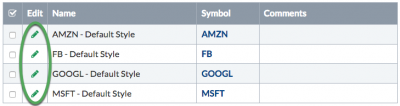
A second easy way to add comments to a chart is to use Edit View of the charts in your ChartList. When looking at your ChartList in Edit View, click the green pencil icon next to the chart you want to add comments to.
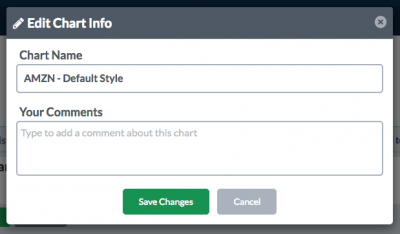
A popup window will appear, which you can use to add or edit comments (in the “Your Comments” box). Once you're done, click the green “Save Changes” button. The comments you've added will be displayed below the chart in 10 Per Page and other ChartList views.
ChartNotes Note Tool
If you want to add freeform text directly onto your SharpChart, one option is to use the “Note” tool. To use this tool, open up your SharpChart in the ChartNotes Annotation window by clicking the “Annotate” link which appears below the SharpChart.
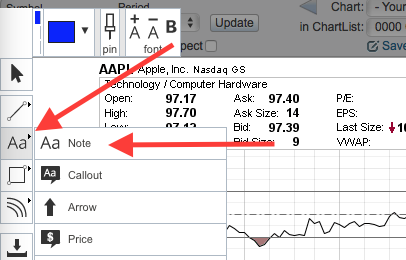
Once your chart appears in the annotation window, click the “Note” icon on the left side toolbar to launch the tool, as shown above. You can then click on the location within the chart where you want to add the note and type your text into the box that appears. When finished, click Ctrl-Enter or click outside the text box to complete the annotation.
ChartNotes Callout Tool
The Callout Tool provided in ChartNotes is another option for you to add comments directly onto the SharpChart. This tool is Callout Tool is a great way to annotate specific movements or trends. To use this feature, open up your SharpChart in the ChartNotes Annotation window by clicking the “Annotate” link below the SharpChart.
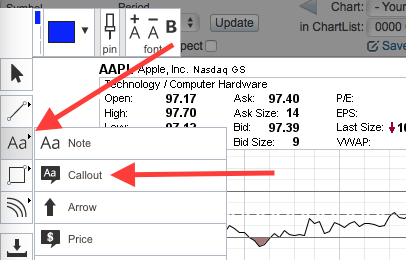
Once your chart appears in the annotation window, click the “Callout” icon on the left side toolbar. Next, click on the location where you want to insert it. Then, you can type your text into the box that appears. Once you're finished typing, click outside the comment box.
Once you have added your comments, you can easily add pointers to the box to point to what you are referring to in your comment. To add the pointers, press and hold down the Ctrl key (Command key if using a Mac), click in the center of the box and drag from one of the four corners using the mouse to the location at which the callout pointer should end.
Note: You can change the color or font size of your note or callout annotation by using the horizontal toolbar on the top side of the annotation window.