This is an old revision of the document!
How Do I Add Extra Horizontal Space to a StockCharts Chart?
To add extra space to a chart to make trend line projections you need to add extra bars to the right of a chart.
This feature is available to all subscribers as well as free users.
Adding the Extra Bars
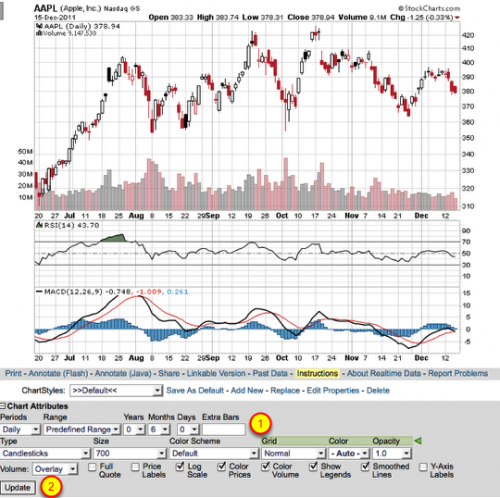
To add extra horizontal space to a chart, go to the “Chart Attributes” section located below the SharpChart. In the box for “Extra Bars” (#1) enter in how many rows you want added to the right and press the “Update” button (#2).
Note: The Extra Bars option is not available if you are using the “Select Start/End” option in the Range dropdown.
**Users can add up to two years of extra bars to your chart. These extra bars are included in the overall chart data limits, which you should keep in mind when configuring your chart. For example, free users are limited to a total of three years of data on their charts, which means that, if they add two years of extra bars, they will only be able to display one year of actual price data on their chart.
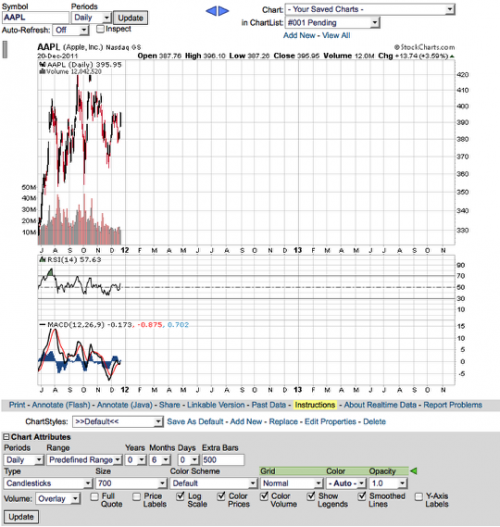
The above chart is an example of what a six-month chart with 500 “Extra Bars” looks like.