What is the blue dashed line I see on intraday charts?
The horizontal blue dashed line on an intraday chart represents the closing value for the previous day. You can see this line in action on the MSFT chart shown below.
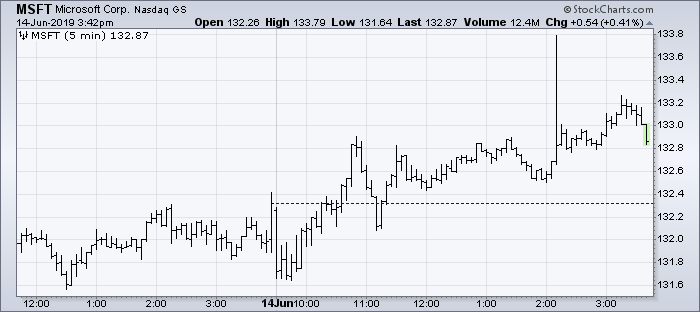
The horizontal blue dashed line on an intraday chart represents the closing value for the previous day. You can see this line in action on the MSFT chart shown below.