Table of Contents
Cryptocurrency Summary
A subset of the Market Summary page, the Cryptocurrency Summary gives you a quick impression of the major cryptocurrencies' performance at a glance.
Accessing the Cryptocurrency Summary
You can access the Cryptocurrency Summary from either the “Member Tools” area of Your Dashboard, or the “Summary Pages” section of the Charts & Tools page.
Using the Cryptocurrency Summary
The Cryptocurrency Summary page shows the performance data for each cryptocurrency over the selected time period. The following time periods are supported:
- Intraday
- One week
- One month
- Three months
- Six months
- Year to Date
- One year
The table shows the cryptocurrency symbol with the latest price, the change since the previous close (in both numeric and histogram format), the volume, and the quote time (using the UTC time zone). The data is updated continually.
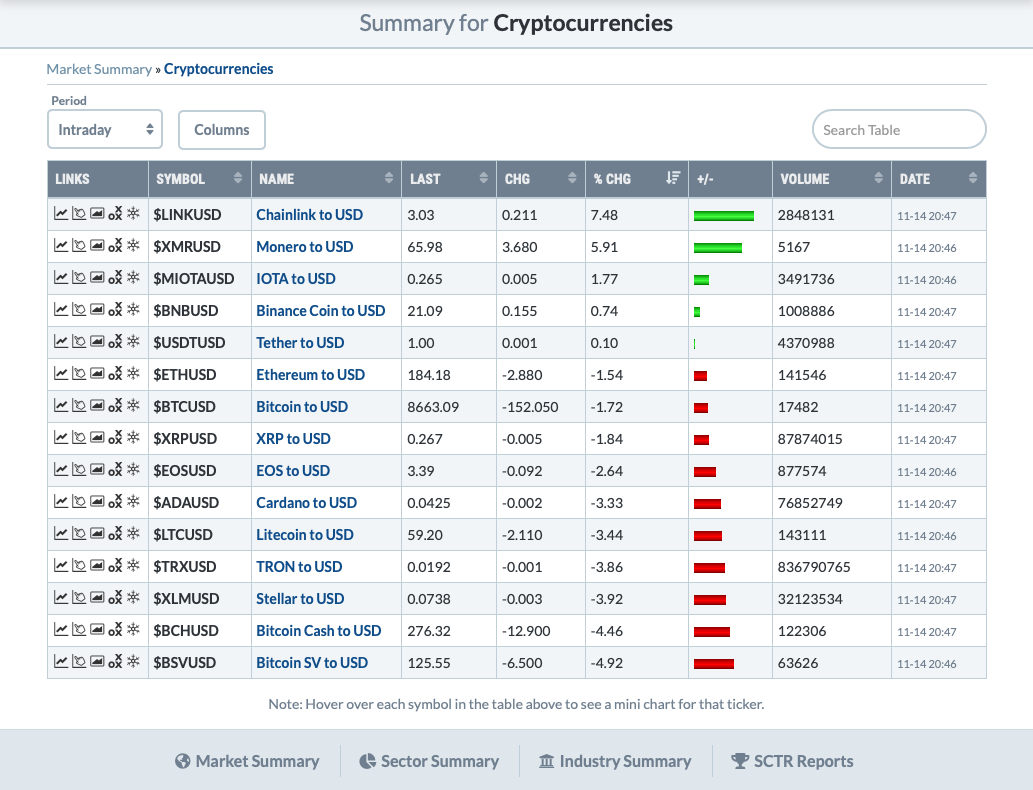
Hover over a ticker symbol to display a mini chart for that symbol. This is a great way to quickly preview multiple cryptocurrencies on the list without ever leaving the Cryptocurrency Summary page.
Click the appropriate icon in the left column of each row in order to display the symbol in a full-scale SharpChart, StockChartsACP, Gallery View, Point and Figure or Seasonality chart.
Additional List Functionality
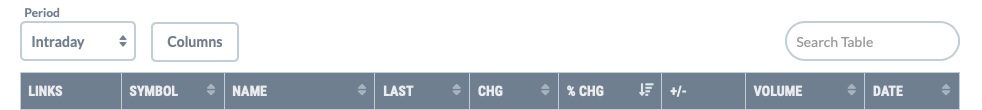
The Cryptocurrency Summary tables have the same functionality as most of the lists on our site:
- You can click the Columns button at the top to show or hide columns in the list.
- To sort by a different column, click the double-arrow icon next to the column header.
- To sort by multiple columns (e.g. sort by column A and then, within each value for A, sort by column B), click the first column, then hold down the shift key while selecting the second column.
- You can also search the items in the list by typing in the Search Table box at the top right.
Next Up » Predefined Scan Results