Table of Contents
Industry Summary
A companion to the Sector Summary page, the Industry Summary helps you quickly find the best-performing industries.
Accessing the Industry Summary
You can access the Industry Summary from either the “Member Tools” area of Your Dashboard or the “Summary Pages” section of the Charts & Tools page. There is also a link to this page at the bottom of the Sector Summary.
Using the Industry Summary
The Industry Summary page shows the performance data for each industry over the selected time period. The following time periods are supported:
- Intraday (members only)
- One day
- One week
- One month
- Three months
- Six months
- Year to Date
- One year
Note: John Murphy recommends starting with a 3-month time period and subsequently adjusting up or down based on your trading style.
The Industry Summary offers two views: the traditional Table View, which provides a compact look at the data; and the new Chart View, which displays half-size charts along with the tabular industry data. Users can switch between these two views by clicking the Table View or Chart View tabs at the top of the page.
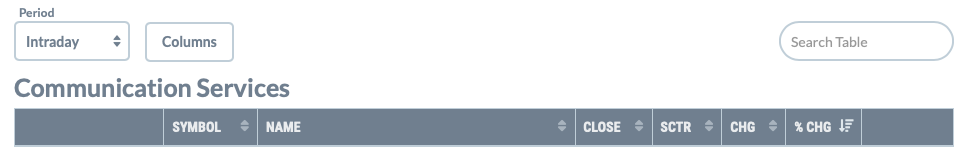
Table View

Each table shows the industry index's symbol with the latest price and the change since the previous close (in both numeric and histogram format). The data is updated continually during market hours.
Click the appropriate icon in the left column of each row in order to display the symbol in a SharpChart, Gallery View, Point and Figure or Seasonality chart. Some industries also have icons to launch a MarketCarpet or PerfChart of stocks in that industry.
Clicking on the name of an industry will take you to a listing of all stocks in that industry.
Additional List Functionality
The Industry Summary tables have the same functionality as most of the lists on our site:
- You can click the Columns button at the top to show or hide columns in the list.
- To sort by a different column, click the double-arrow icon next to the column header.
- To sort by multiple columns (e.g. sort by column A and then, within each value for A, sort by column B), click the first column, then hold down the shift key while selecting the second column.
- You can also search the items in the list by typing in the Search Table box at the top right.
Chart View
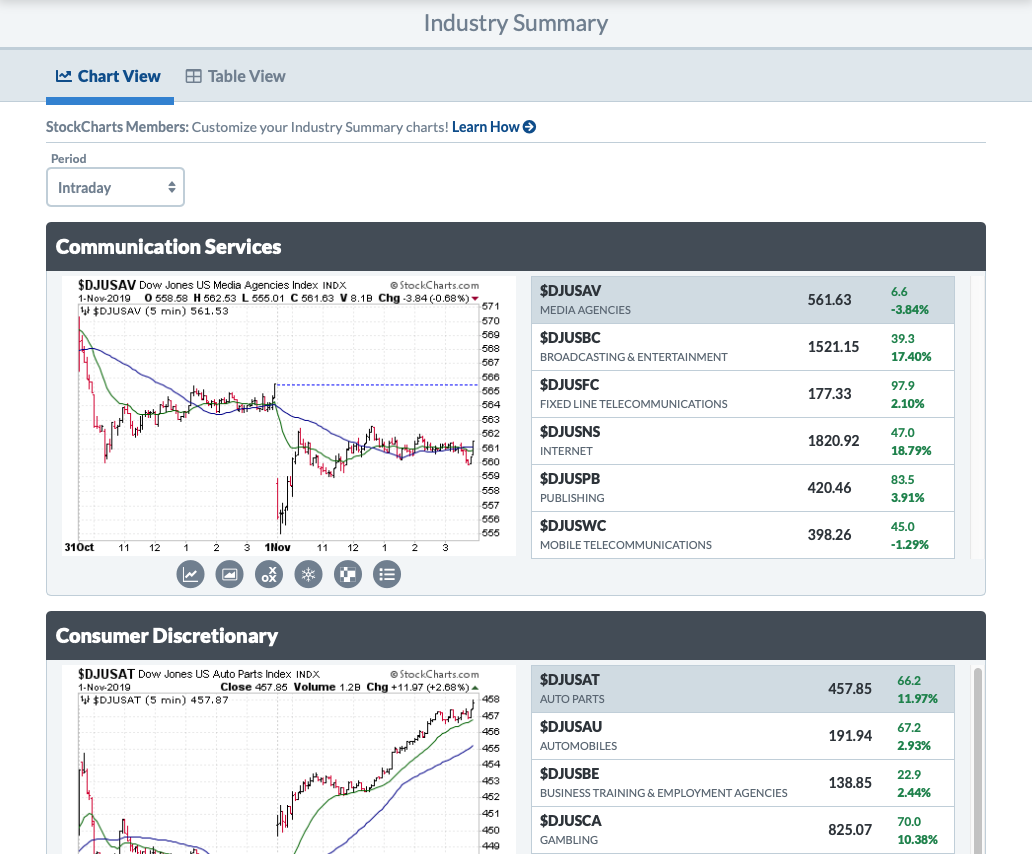
In Chart View, each section shows the industry index's symbol with the latest price and the change since the previous close. The data is updated continually during market hours.
On the left side of each section is a half-size chart of the currently-selected industry index. To view the half-size chart for a different industry, simply click on it in the table on the right.
Click the appropriate icon below the chart in order to launch a full-size SharpChart, Gallery View, Point and Figure or Seasonality chart. Some industries also have icons to launch a MarketCarpet or PerfChart of stocks in that industry.
Clicking on the “Industry Members” icon will take you to a listing of all stocks in that industry.
Industry Summary Style
Members can customize the settings and indicators used for the half-size charts in the Industry Summary by creating a ChartStyle with a specific name. If a ChartStyle named “Industry Summary” is found in your account, it will be used instead of the default style when displaying charts in the Chart View of the Industry Summary.
To change the way that charts on the Industry Summary page look, create a chart that looks the way you want your Industry Summary charts to look, then save it as a ChartStyle with “Industry Summary” as its name. Visit the Chart View of the Industry Summary page and you should now see your new settings/indicators on the charts.