Table of Contents
Market Summary
Designed by John Murphy, the Market Summary page gives you a quick impression of the major market averages and common indexes - typically during the current market session.
The Market Summary page contains a number of tables summarizing major areas of the market, including major markets and indexes, sectors and industries, international markets, bonds, commodities, cryptocurrencies, currencies, and market breadth measures (such as Bullish Percent Indices).
Check out our Market Summary overview video below, or just read on to learn how to get the most out of the Market Summary.
Accessing the Market Summary
You can access the Market Summary from either the “Member Tools” or “Market Overview” areas of Your Dashboard, or from the “Summary Pages” section of the Charts & Tools page.
Market Summary Versions
Many of the items in the regular Market Summary are indexes or indicators that are only updated after the market closes. To overcome that limitation, StockCharts offers different versions of the Market Summary, each using a slightly different set of indexes, indicators and ETFs to summarize the market.
There are four versions of the Market Summary available:
- Intraday - displays market summary info using symbols that update throughout the trading day
- End-Of-Day - displays market summary info using symbols that update at the end of the trading day
- ETF - displays market summary info using only ETFs
- Combined - displays market summary info using all symbols from the Intraday and End-Of-Day versions
You can use the dropdown menu above the Market Summary to change to a different version.
Using the Market Summary
The Market Summary offers two views: the traditional Table View, which provides a compact look at the data; and the new Chart View, which displays half-size charts along with the tabular market data. Users can switch between these two views by clicking the Table View or Chart View tabs at the top of the page.
Table View
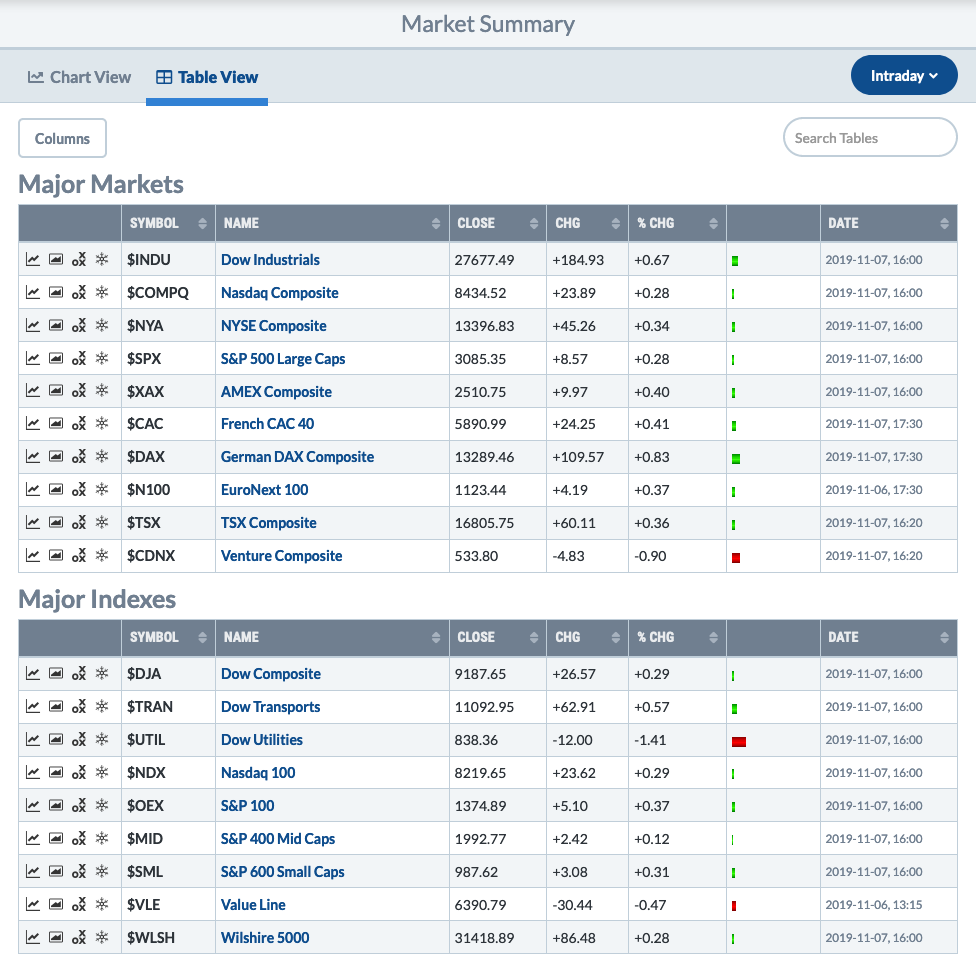
Each table shows the symbol with the latest price, the change since the previous close (in both numeric and histogram format) and the quote time (using the Eastern time zone). The data is updated continually during market hours.
Click the appropriate icon in the left column of each row in order to display the symbol in a SharpChart, Gallery View, Point and Figure or Seasonality chart.
Additional List Functionality
The Market Summary tables have the same functionality as most of the lists on our site:
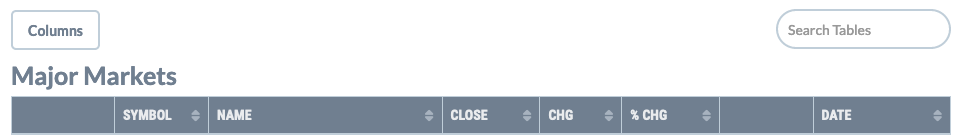
- You can click the Columns button at the top to show or hide columns in the list.
- To sort by a different column, click the double-arrow icon next to the column header.
- To sort by multiple columns (e.g. sort by column A and then, within each value for A, sort by column B), click the first column, then hold down the shift key while selecting the second column.
- You can also search the items in the list by typing in the Search Table box at the top right.
Chart View
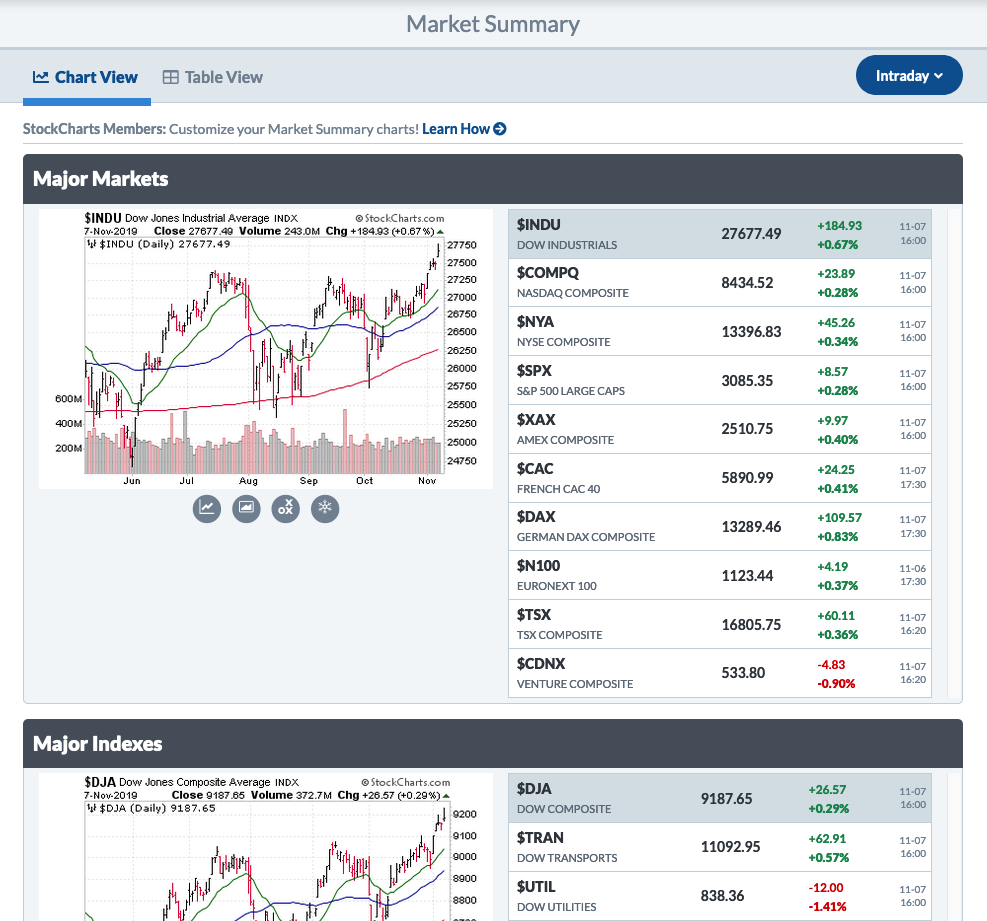
In Chart View, each section shows the symbol with the latest price and the change since the previous close. The data is updated continually during market hours.
On the left side of each section is a half-size chart of the currently-selected index, indicator or ETF in that section. The chart is overlaid with 20-day (green), 50-day (blue) and 200-day (red) simple moving averages by default.
To view the half-size chart of a different symbol, simply click on the symbol in the table on the right.
Click the appropriate icon below the chart in order to launch a full-size SharpChart, Gallery View, Point and Figure or Seasonality chart for that symbol.
Market Summary Style
Members can customize the settings and indicators used for the half-size charts in the Market Summary by creating a ChartStyle with a specific name. If a ChartStyle named “Market Summary” is found in your account, it will be used instead of the default style when displaying charts in the Market Summary.
To change the way that charts on the Market Summary page look, create a chart that looks the way you want your Market Summary charts to look, then save it as a ChartStyle named “Market Summary.” Visit the Chart View of the Market Summary page to see your new settings/indicators on the charts.