Table of Contents
Sector Summary
The Sector Summary page is designed to help you quickly find the best performing stock in the best-performing Industry in the best-performing Sector with just a couple of clicks.
Check out our Sector Summary overview video below, or just read on to learn how to get the most out of the Sector Summary.
Accessing the Sector Summary
You can access the Sector Summary from either the “Member Tools” area of Your Dashboard, or the “Summary Pages” section of the Charts & Tools page.
Using the Sector Summary
Sector View
Initially, the Sector Summary page shows you the eleven S&P Sector ETFs, which are ranked by performance over the selected time period.
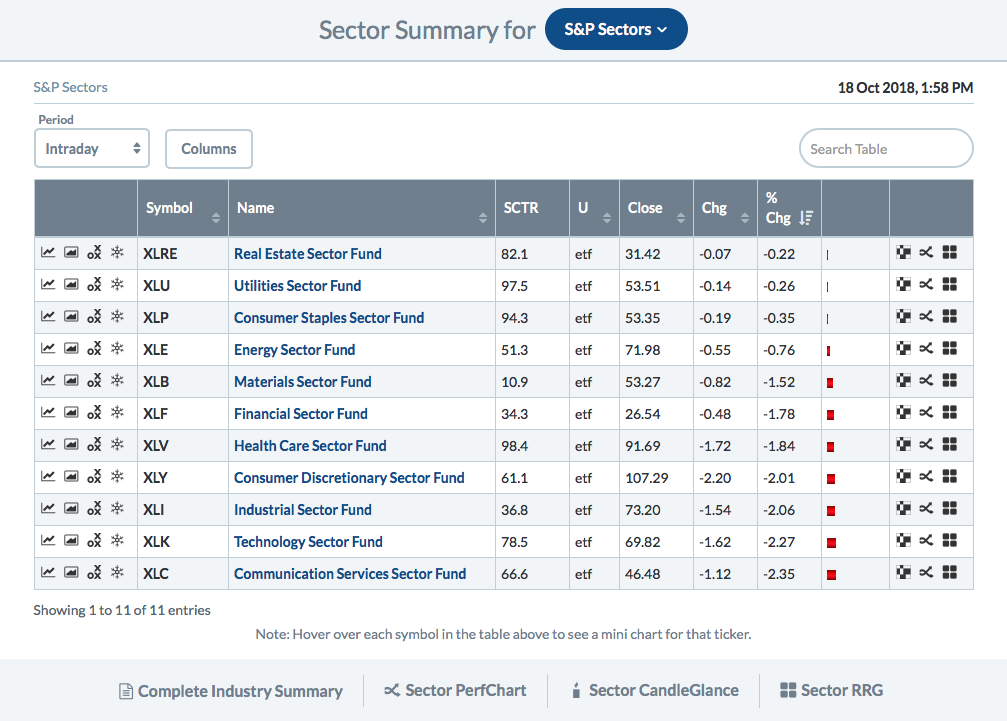
The following time periods are supported:
- Intraday (members only)
- One day
- One week
- One month
- Three months
- Six months
- One year
Note: John Murphy recommends starting with a 3-month time period and subsequently adjusting up or down based on your trading style.
Click the appropriate icon in the left column of each row in order to display the S&P Sector ETF in a SharpChart, Gallery View, Point and Figure or Seasonality chart.
In the right column, there are icons that allow you to view the sector members in a MarketCarpet, PerfChart or RRG chart. Note that some icons may not be available for sectors or industries with a large number of members.
Industry View
You can click on the name of any sector in the Sector View to see all of the Dow Jones Industry indexes associated with that sector. The industries are also ranked by performance over the selected time period.
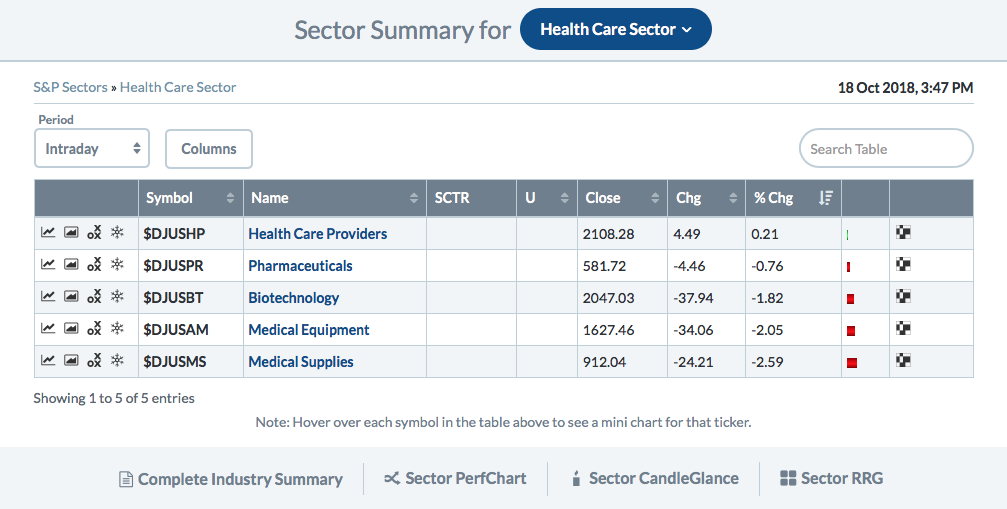
Note: At the bottom of each Sector Summary page, there is a link to the Complete Industry Summary page, which displays the industries associated with all eleven sectors on a single page.
Stock View
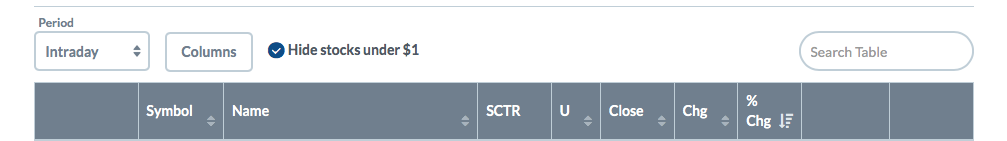
Finally, you can click on the name of any industry to see all of the stocks that make up that industry index. The stocks are also ranked by performance over the selected time period.
Note: By default, stocks that are less than $1 will not be shown on the list. To show these stocks, uncheck the box next to “Hide stocks under $1” at the top of the list.
Additional List Functionality
The Sector Summary views have the same functionality as most of the lists on our site:
- You can click the Columns button at the top to show or hide columns in the list.
- To sort by a different column, click the double-arrow icon next to the column header.
- To sort by multiple columns (e.g. sort by column A and then, within each value for A, sort by column B), click the first column, then hold down the shift key while selecting the second column.
- You can also search the items in the list by typing in the Search Table box at the top right.
Additional Resources
Videos
Articles
- StockCharts Historical Sector Data - learn how StockCharts provides historical data for analysis of the Real Estate and Communication Services sectors.
Next Up » Industry Summary