This is an old revision of the document!
Table of Contents
Symbol Summary
The Symbol Summary page is designed to provide a wide range of information about a specific security, all in one convenient location. The page includes important fundamental and technical data, a mini-chart, company summary, and a listing of predefined scans, price alerts, and saved charts featuring the security. It's a great way to get a quick overall look at a symbol, then zero in on the information that matters most to you.
Accessing the Symbol Summary
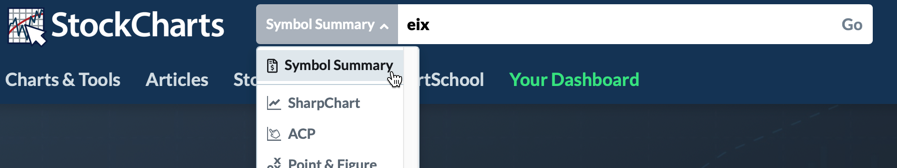
The easiest way to access the Symbol Summary is from the Create-a-Chart bar at the top of each page. Simply change the dropdown menu to “Symbol Summary”, enter the ticker symbol you want to view, and click Go.
You can also access the Symbol Summary from the “Member Tools” area of Your Dashboard, or the “Summary Pages” section of the Charts & Tools page.
Symbol Summary Components
The Symbol Summary page has several different panels, each containing different types of information about the security.
Header Area
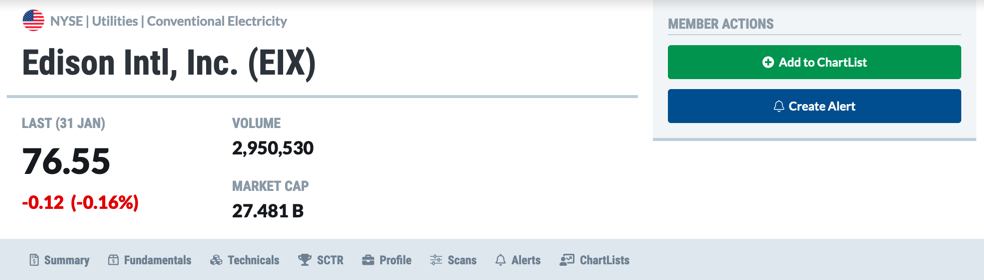
At the top of the Symbol Summary, you can see the security's name, exchange, and where applicable, sector and industry information. The latest price quote is displayed, along with the price change, volume, and market cap information. To the right, Member Actions buttons allow logged in members to quickly add the ticker symbol to one of their ChartLists or create a price alert for the symbol. Below the price quote, a series of links provide quick access to other parts of the Symbol Summary page.
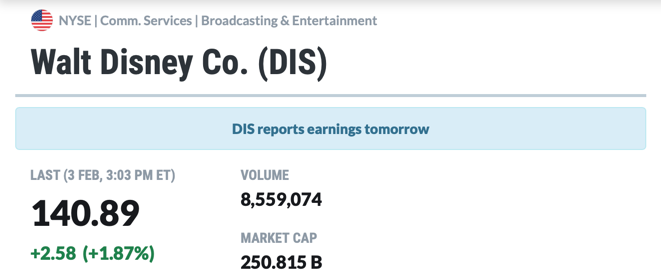
When symbols are reporting earnings, a notification is also shown in this area. In the example below, DIS is reporting earnings the next day, so a light blue earnings notification banner is shown above the price. The banner is light orange on the day earnings are reported, and light green on the day after earnings are reported.
During the pre- and post-market trading sessions, after-hours price data will also be shown in this section of the Symbol Summary:
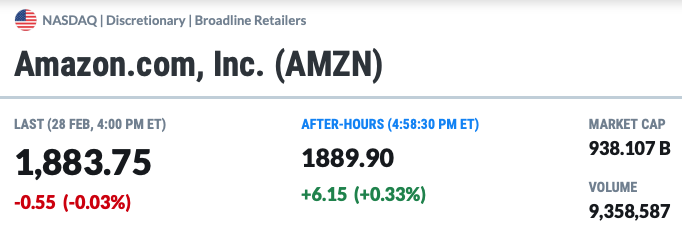
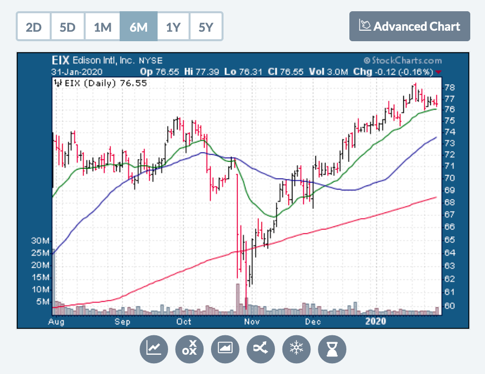
Chart Area
A half-size chart of the security is displayed in this area of the Symbol Summary. Buttons above the chart allow you to change the chart's period; logged in members can see any chart period from two-day intraday charts up to a 5-year weekly chart within the Symbol Summary. Buttons below the chart allow you to launch a full-size SharpChart, P&F Chart, Gallery View chart, PerfChart, or Seasonality chart, or view historical data in tabular form. The Advanced Chart button above the chart will load a chart for the ticker symbol in StockChartsACP.
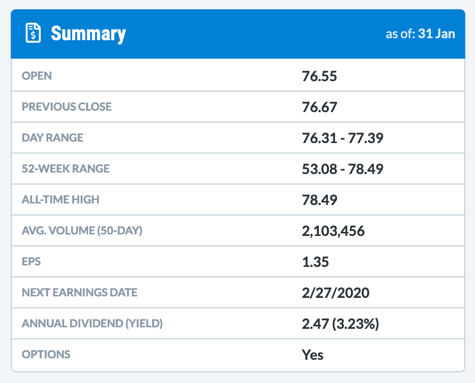
Summary Area
The Summary panel in the Symbol Summary gives quick access to commonly-requested stats that are not in the Header Area. In this panel, users can see the open, previous close, high-low range for the day or the previous 52 weeks, the all-time high, and the 50-day average of volume. Limited fundamental data is also available in this panel: earnings per share (EPS), the next scheduled earnings date, the annual dividend (yield), and whether or not the security trades options.
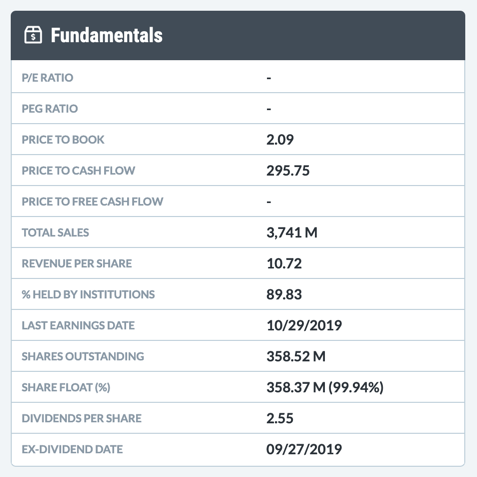
Fundamentals Area
The Fundamentals panel shows more extensive fundamental data where applicable, including P/E ratio, Revenue Per Share, Last Earnings Date, Shares Outstanding, Dividends per Share, Ex-Dividend Date, and more.
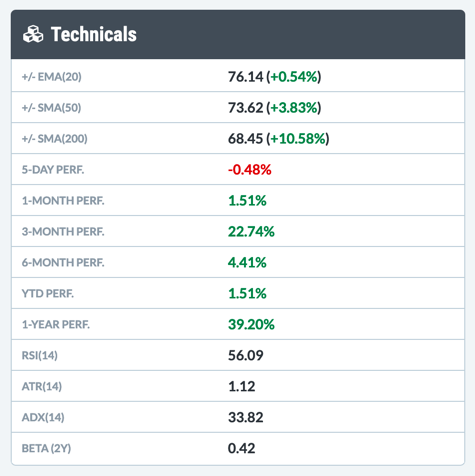
Technicals Area
The Technicals panel shows popular technical values for the security where applicable, including percent above or below certain moving averages, performance over selected timeframes, and values for commonly-used technical indicators such as RSI, ATR, ADX, and Beta.
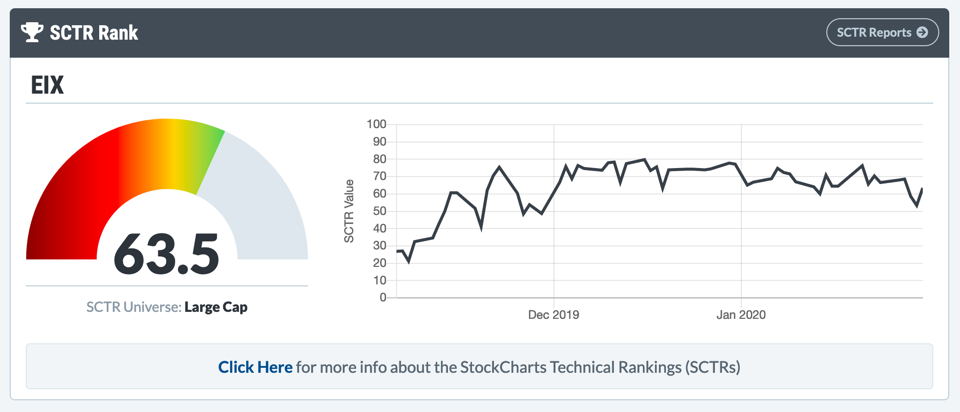
SCTR Rank Area
For securities that have a StockCharts Technical Rank (SCTR) value, this panel shows the current SCTR ranking and a three-month chart of SCTR values for the ticker symbol. The SCTR Reports button at the top gives you quick access to our full range of SCTR Reports. For more information about SCTRs and how they are calculated, please see our ChartSchool article on this topic.
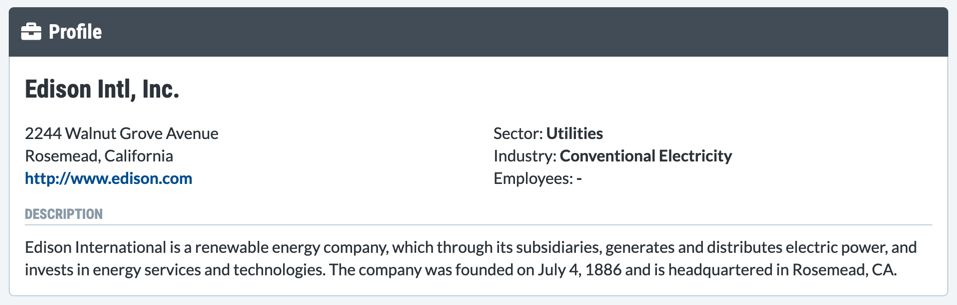
Profile
For many US and Canadian companies, the Profile panel will show the company address, URL, sector and industry, along with a short description of the company. For most ETFs, the panel gives a brief description of the fund, as well as a URL with more fund information. If no profile information is available for a security, the Profile panel will not be shown.
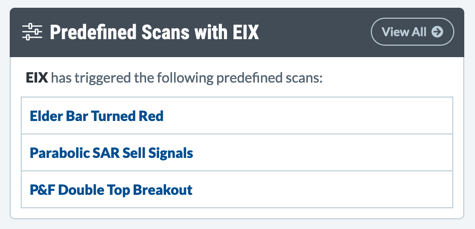
Predefined Scans Area
This panel will show any predefined scans that have recently been triggered for the ticker symbol. Clicking the View All button at the top of the panel will take you to the complete Predefined Scans results.
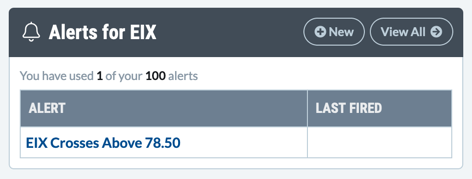
Alerts Area
For logged in Extra or Pro members, this panel will show you any price alerts that you have set up for the ticker symbol, as well as the most recent time that the alert has been triggered. Click on the alert to open it in the Alert Workbench. You can quickly create a new price alert for this ticker symbol by clicking the New button at the top of the panel. The View All button allows you to see all of your alerts at a glance.
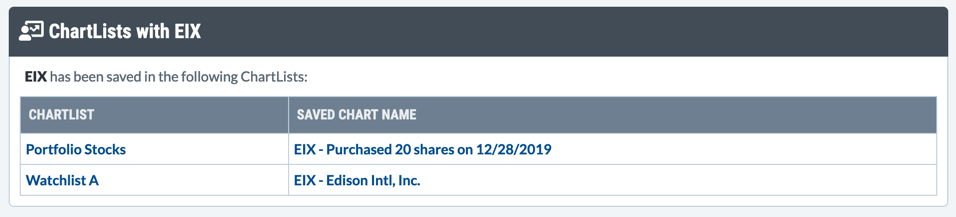
ChartLists Area
For logged in members, this panel shows any charts with this ticker symbol that you have saved to one of your ChartLists. Click the Saved Chart Name to launch the chart, or the ChartList name to see the entire ChartList. To quickly add the ticker symbol to one of your existing ChartLists, click the “Add to ChartList” button at the top of the Symbol Summary.
Next Up » Market Summary