Table of Contents
Scanning Your ChartLists
We all have various watchlists stored in ChartLists, but manually reviewing a large number of watchlist stocks on a regular basis can be quite time-consuming. One alternative for members is to periodically run a scan of their watchlists which looks for unusual activity in price, volume, and/or technical indicator values. This may include crossovers, divergences, or overbought/oversold levels. Running this scan could narrow down the number of stocks on your watchlists that need manual reviewing, allowing you to focus on and quickly review a smaller subset of stocks.
This article will show you how to scan one ChartList or many ChartLists, and introduce you to a few helpful ChartList scanning tricks, including using scans to reorder a ChartList, or download your ChartList symbols to a spreadsheet for further analysis.
Adding a ChartList Clause to Your Scan
It's pretty easy to add a ChartList clause to your scan. Simply choose one of your ChartLists from the ChartLists dropdown menu in the Scan Components area. Then click “Add”.
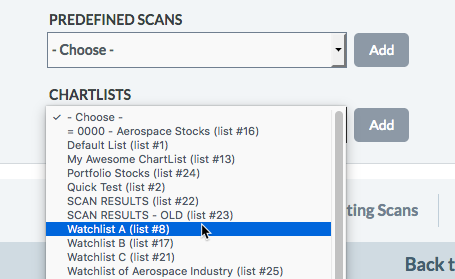
Selecting the pictured option from the ChartLists dropdown menu adds the following scan clause to your scan:
[favorites list is 8] // Watchlist A
The first thing to note is that the scan engine refers to your ChartList by a reference number (in the example above, 8). The ChartList name that you use (Watchlist A) appears in a comment after the clause. Since you may not know the reference number for your ChartList, the best way to add one to your scan is to select it from the ChartLists dropdown menu. Of course, your ChartList reference number and name will be different than the one in the example.
Now that you've defined your scan universe as just this one ChartList, you can add scan clauses that test for whatever signals or technical conditions you require. For example, this scan looks for symbols on the “Watchlist A” ChartList that have closing price action 10% above their 20-day simple moving average:
[favorites list is 8] // Watchlist A
and [close > SMA(20, close) * 1.10]
Warning: Scanning a ChartList will only return symbols on the ChartList that are actually in the scan engine. Some symbols are not available in the scan engine, so they will not be returned as scan results even if they are in the ChartList being scanned.
Scanning Multiple ChartLists At Once
Rather than running separate scans for each of your many ChartLists, you can scan multiple ChartLists in a single scan.
To do this, add more than one ChartList clause to your scan, using the same technique described in the previous section. Once you're done, your exact ChartList names and reference numbers will differ, but your scan criteria should look something like this:
[favorites list is 8] // Watchlist A
and [favorites list is 17] // Watchlist B
and [favorites list is 21] // Watchlist C
As it is now, the scan will only find a symbol that appears on all three ChartLists. If we want it to scan for symbols that appear on at least one (but not necessarily all) of the ChartLists, we need to make a couple of changes to the scan.
First, change the “and” to “or” on line 2 and line 3 of the scan:
[favorites list is 8] // Watchlist A
or [favorites list is 17] // Watchlist B
or [favorites list is 21] // Watchlist C
This will tell the scan engine that we want stocks that are in Watchlist A or Watchlist B or Watchlist C.
Next, add a set of square brackets around all 3 clauses, to show that they are all part of the same “Or” scan criteria:
[
[favorites list is 8] // Watchlist A
or [favorites list is 17] // Watchlist B
or [favorites list is 21] // Watchlist C
]
This is not strictly necessary when there are no other clauses in the scan, but is very important once other clauses have been added. For more information about why these extra brackets are so important, read about “Or” clause issues in our Troubleshooting Scans article in the Support Center.
Now you can add your technical condition and signal criteria to the scan, and you'll be ready to scan multiple ChartLists at once.
Reordering a ChartList Using Rank By
By default, ChartLists are sorted alphabetically by chart name, but sometimes you may be interested in sorting them by industry, or price, or a particular indicator value. Scanning provides a great way to do this.
Let's say we want to see a ChartList ranked by MACD Histogram value. We can scan for a specific ChartList, and use the RANK BY scan clause to change the sort order of the symbols:
[favorites list is 8] // Watchlist A
RANK BY [MACD Hist(12,26,9)]
This will display the symbols on your ChartList, along with their MACD Histogram value, sorted in descending order of MACD Histogram value. If you just need to sort them this way temporarily, you can stop here.
If you're interested in keeping this sort order permanently, you can choose either “Store these results in a new ChartList” or “Replace an existing ChartList with these results” from the Available Actions menu above the scan results table. In either case, be sure to check the “Preserve Sort Order” checkbox when saving the scan results in the ChartList. This will prepend numbers to each chart name, so they will be sorted by MACD Histogram value.
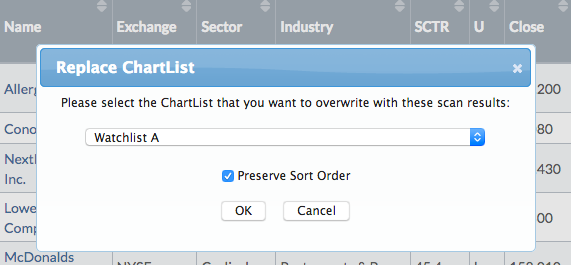
The advantage of storing the sort order in a ChartList is that the symbols can be looked at in that order using ChartList views like 10 Per Page, CandleGlance, etc.
Note: It is important to understand that the results are saved to the ChartList in the sort order they were in at the time you ran the scan. If the MACD Histogram values change later on, the order of the symbols in the ChartList will not be changed.
Saving a ChartList to a Spreadsheet
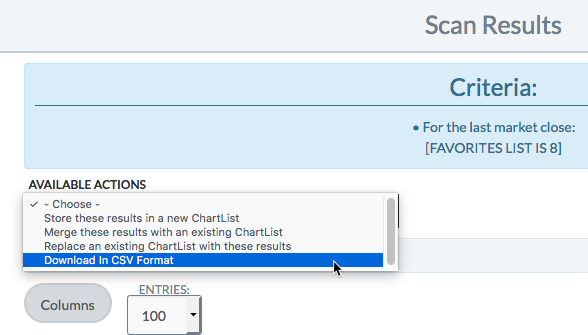
Sometimes you want to do some offline analysis of the stocks in your watchlist, and spreadsheets work well for that. So, how do you get the symbols in your ChartList downloaded to a spreadsheet?
Start with a simple one-clause scan to retrieve all the symbols in your ChartList:
[favorites list is 8] // Watchlist A
Then choose “Download in CSV Format” from the Available Actions menu. Save the file, and open it in your favorite spreadsheet program.
Conclusions
These four techniques for scanning your ChartLists can greatly speed up the process of reviewing a watchlist. Whether you're looking to search them, reorder them, or download them, scanning will help you really get the most out of your ChartLists.
Remember: Scanning a ChartList will only return symbols on the ChartList that are actually in the scan engine. Some symbols are not available in the scan engine, so they will not be returned as scan results even if they are in the ChartList being scanned.