Table of Contents
Scanning for Divergences
One of the most important technical signals to watch for on any chart is a divergence. To put it simply, a divergence occurs when prices move in one direction (up or down) and an indicator based on those prices moves in the opposite direction. In this article, you'll learn some ways to detect divergences with our Scan Engine.
Divergences signal impending changes in the direction of a stock's price. They come in two flavors - “positive” (AKA “bullish”) and “negative” (AKA “bearish”). A positive divergence happens when an indicator starts moving higher after prices have been in a downtrend (a potentially bullish development). A negative divergence occurs when an indicator moves lower while prices are still rising and is a bearish warning signal.
Any oscillating indicator can be used in a divergence study. Popular choices include the MACD, Stochastics and Wilder's RSI. Many people also use indicators that include volume information - Chaikin Money Flow, for example - since price and volume often diverge at key turning points.
Unfortunately, like many things in the field of technical analysis, spotting divergences while they are still forming can be tricky. The biggest problem is distinguishing between a real divergence and just random “noise” on the chart. The fact that a stock moves up for two days while one of its oscillating indicators (e.g. RSI) declines does not necessarily mean that a significant divergence has developed - yet.
Manually Finding Divergences
Peak-and-Trough Analysis
Often, peak-and-trough analysis is used to find divergences. If, for example, two or more rising troughs appear on the price plot (an uptrend) while two or more declining peaks appear at the same time on the indicator graph (a downtrend), a bearish divergence has been identified. This is how divergence is often taught in textbooks.
As with all forms of peak-and-trough analysis, there are two key problems with this approach. The first problem is that clear trendlines take time to form; the underlying trading opportunity associated with the divergence may be over by the time an unambiguous picture appears on the chart. The second problem is that identifying significant peaks and troughs is often very subjective - one person's significant peak is another person's random spike. For these reasons, peak-and-trough divergence detection is hard to automate (meaning you can't create scans for it) and it is best used for finding exit signals for existing positions.
Divergence Scanning Methods
Using Rising/Falling Clauses
Simple divergence scans can be created by selecting a somewhat arbitrary time duration (5 days, for example) and seeing if prices have increased by more than a given percentage while the associated indicator decreased by a different given percentage over that same period. Here's a sample scan that uses that technique:
[type = stock]
and [close > 5 days ago close * 1.025]
and [[[macd line(12,26,9) - 5 days ago macd line(12,26,9)] / AbsVal(5 days ago macd line(12,26,9))] < -0.08 ]
In this example, the price must have increased by at least 2.5% over the past five days, while the MACD value must have decreased by at least 8%. Here's one of the charts that this scan returned on June 11, 2018:
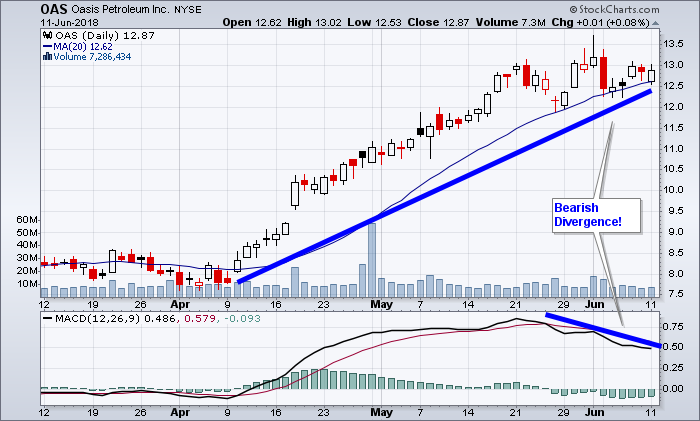
While this technique is easy to program into a scan engine, its results are hit-and-miss. Many of the charts returned by this kind of scan are not really experiencing a negative divergence. A visual review of all stocks returned by this kind of scan is a necessity.
Using Min/Max Functions
A different technique is to use the Min and Max functions to ensure that we are at the highest (or lowest) point on the chart for a given time duration. If the stock's price is higher than it was at any point in the past 5 days (for example) and the indicator is currently lower than it ever had been during that same period, there's a good chance a divergence is occurring. Here's a sample scan that uses that technique:
[type = stock]
and [close > yesterday's max(5,close)]
and [CMF(20) < yesterday's min(5,CMF(20))]
In this example, we're looking for stocks that closed higher than the highest close during the previous five days and has a Chaikin Money Flow (CMF) reading that is currently lower than the lowest reading during the previous five days. Here's one of the charts that this scan returned on June 11, 2018:
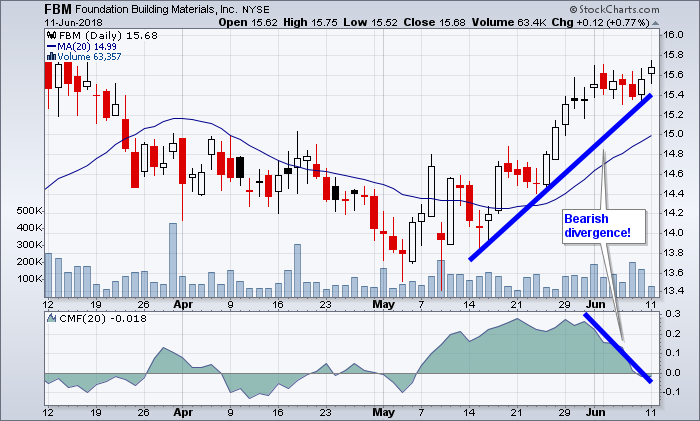
This technique is not foolproof either; it requires a visual inspection of the results to determine whether a divergence is actually taking place.
Conclusions
Even though the results require some manual analysis, divergence scans are well worth incorporating into your stock-hunting toolkit. While no divergence scan is perfect, the two techniques above are good starting points that can be customized to suit your trading style. These scans can help you identify a smaller pool of possible divergence candidates, which can then be manually reviewed using traditional peak-and-trough analysis.