Table of Contents
Writing Min/Max Scans
The Min() and Max() functions are some of the more powerful scanning functions available at StockCharts, allowing you to compare a value to its range of values over a set period of time. Below, we outline four useful techniques for scanning with these functions.
Scanning for Highs
The Max() function is commonly used to scan for highs; in fact, it is used in our “New 52-week High” predefined scan. To view the syntax for this predefined scan clause, go to the Advanced Scan Workbench. From the Predefined Scans dropdown menu, choose “New 52-week High” and click “Add” to insert the clause into the Scan Criteria box.
By default, the scan clause looks like this:
[today's high > yesterday's daily max(253,high)]
The scan requires today's high to be greater than the maximum high observed anywhere over the previous 253 days (a calendar year has approximately 253 trading days).
In graphical form, the scan looks something like this:
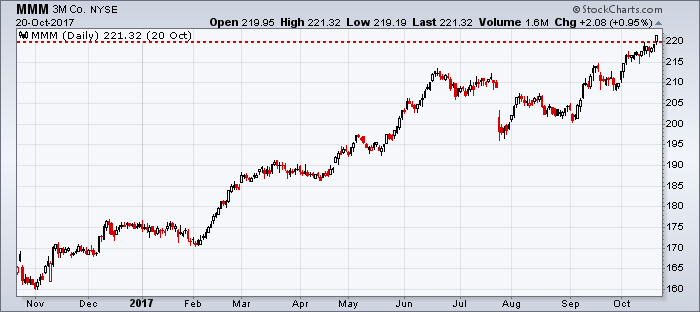
The chart shows 1 year of data for 3M Co. (MMM). The red dashed line shows the highest closing value for the previous 253 days. Notice that only the most recent candlestick goes above this line - that is the new 52-week high.
If we wanted a new high “Close” instead of just the “High” (which could be an intraday high), there is no predefined scan for this, but we can easily modify the example above. Just replace today's “high” with “close” and replace the max “high” with “close” as below.
[today's close > yesterday's daily max(253,close)]
A Note on Date Ranges
You may have noticed that the scan clauses above specify that today's value must be greater than the previous 253 days' values, starting with yesterday's value. It's important that today's value is excluded from the Max() function. Let's take a quick look at the reason for this. Suppose our clause was:
[today's high > today's daily max(253,high)]
Imagine a stock that is hitting a new 52-week high of $100, right now. In that case, “today's high” equals 100 and “max(253,high)” also equals 100 (since today's high is included in that Max() function). Substituting those values into the scan criteria, we're left with “100 > 100” which will always be false. We will get zero results every time we run this scan.
For this reason, you must be sure to define your range for the Max() and Min() functions carefully, making sure that the value you're checking is not included in the range. If you were checking to see if yesterday's value was a new 52-week high, you'd want to use something like this:
[yesterday's high > 2 days ago daily max(253,high)]
This way, the value you're checking (yesterday's high), is excluded from the range used in the Max() function.
Scanning for Lows
The Min() function works much the same way as the Max() function, but looks for the lowest value in a range rather than the highest. Scanning for new 52-week lows looks very similar to the scan clause for new 52-week highs:
[today's low < yesterday's daily min(253,low)]
While the Min() and Max() functions are frequently used to check for price highs and lows, these functions can actually be used to check for highs and lows of any values. The following example checks whether the Chaikin Money Flow indicator value is the lowest it's been in the previous 10 trading days:
[CMF(20) < yesterday's min(10,CMF(20))]
Notice that we are using “yesterday” with the Min() function, just like we did with our Max() function, so that the value we are checking is not included in the range.
Scanning for Divergences
We can put our previous two examples together in order to scan for stocks that might have a negative divergence:
[today's high > yesterday's daily max(10,high)]
and [CMF(20) < yesterday's min(10,CMF(20))]
This example looks for securities that are currently having a 10-day high in price, but have the lowest Chaikin Money Flow value they've had in the past 10 days. This scan would produce a list of stocks that have a high potential for a negative divergence (the indicator is low while the price is high).
That list could be saved in a ChartList and then viewed in CandleGlance mode, allowing you to easily spot which stocks were actually having a negative divergence.
Scanning for Consolidation
Min() and Max() can be used together with arithmetic functions to scan for stocks that are in a narrow trading range. While these stocks are consolidating, they will not vary much above or below their moving average each day.
Let's say we want to find stocks that have been trading within 1% of their simple moving average over the last 10 days - a very tight consolidation range. To scan for this, we need to add two clauses:
- The first clause should check that the highest value over the last 10 days is less than 1% over the 10-day SMA.
- The second clause should check that the lowest value over the last 10 days is no more than 1% below the 10-day SMA.
[max(10,close) < SMA(10,close)*1.01]
and [min(10,close) > SMA(10,close)*0.99]
This criteria will find stocks with charts like the following:
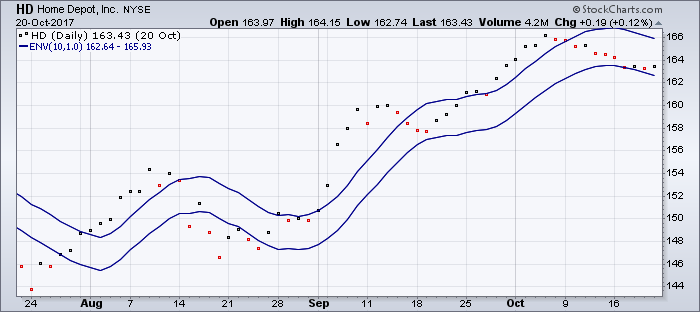
This chart uses the Dots chart type to display the closing prices for each day. The moving average envelopes are showing 1% above and below the moving average. You can see that over the previous 10 days, the dots all fall within those envelope lines.
Conclusions
While the Max() and Min() scanning functions are traditionally used to find new price highs and lows, they can be used to scan for highs and lows of almost anything. Put together in a single scan, they can be used to search for possible divergences or to find values that fall inside or outside of a range.