Table of Contents
Scanning for an Overlay of an Indicator
Overlays are typically based on price data, but they can also be useful for analyzing technical indicator values. For example, chartists often use moving average overlays to smooth indicator data or create a “signal line” for an indicator that doesn't have one.
Take the example chart below:
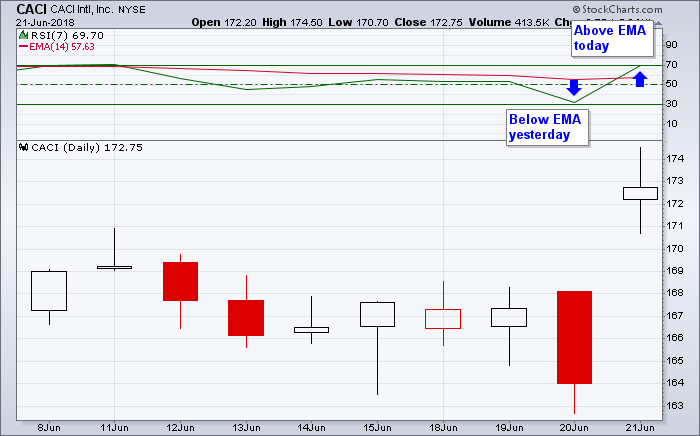
Above the main price plot, we've set up a 7-day RSI indicator, along with a 14-day EMA of that RSI line. For more info on configuring a chart like this, see our Support Center article on adding indicators with overlays to your SharpCharts.
With this very short-term chart, it's easy to see where a crossover of these two lines happened. Yesterday, the RSI value was below its 14-day EMA; today, it has crossed above its 14-day EMA. But how do we write a scan for that crossover signal?
Example Overlay Scan
We already know how to scan for a 14-day EMA of price data:
[Close x EMA(14, Close)]
In the example above, we are scanning to see if the close has crossed above its own 14-day EMA. That EMA forms our overlay, while the closing price is our “indicator.”
To scan for the EMA of the 7-day RSI instead, simply replace “close” with “RSI(7)” in your scan clause:
[  Close   x EMA(14,  Close   )]
[  RSI(7)  x EMA(14,  RSI(7)  )]
Now, we are scanning for the 7-day RSI value to cross over its own 14-day EMA. We are using the RSI indicator in this example, but remember that almost any indicator can be plugged into the scan clause in place of “close.”
Tip: When replacing the “close” with an indicator, be sure that all your opening and closing parentheses match up. Since EMA and RSI indicators both have a closing parenthesis at the end, you will end up with two closing parentheses right before your closing square bracket.
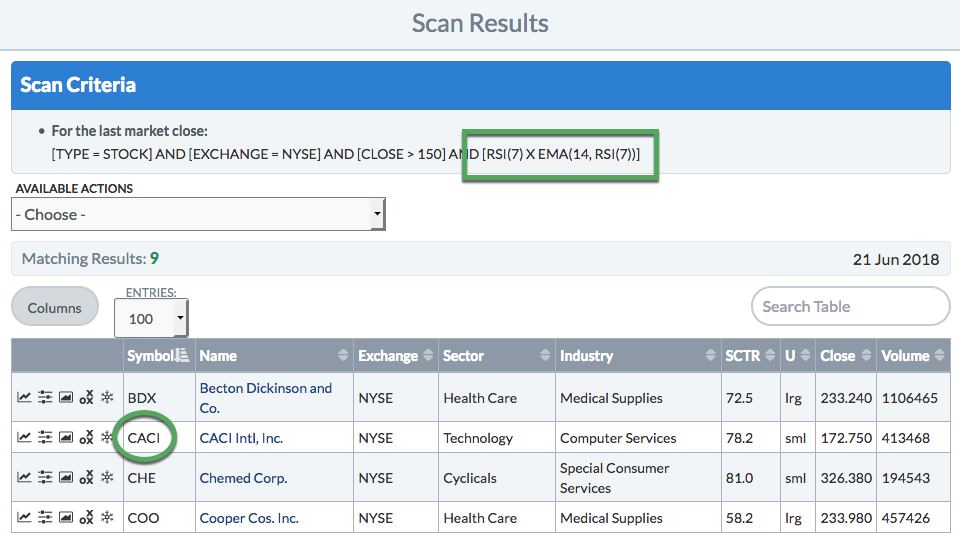
We can double-check our syntax by running the new scan and confirming that the symbol from our chart is found by the scan. In this case, we see CACI in the scan results:
Overlays Available for Scanning
The example above shows you how to scan for an EMA overlay of the RSI indicator, but overlays are not limited to EMAs. Below are a few scan clause examples for the overlays that are most commonly used in scans:
Exponential Moving Averages
CCI Crossing Over Its EMA
In this example, the 20-day CCI is crossing above its own 8-day EMA.
[CCI(20) x EMA(8,CCI(20))]
Smoothed MACD Line Below Zero
In this example, the 10-day EMA of the MACD Line must be below zero.
[EMA(10,MACD Line(12,26,9)) < 0]
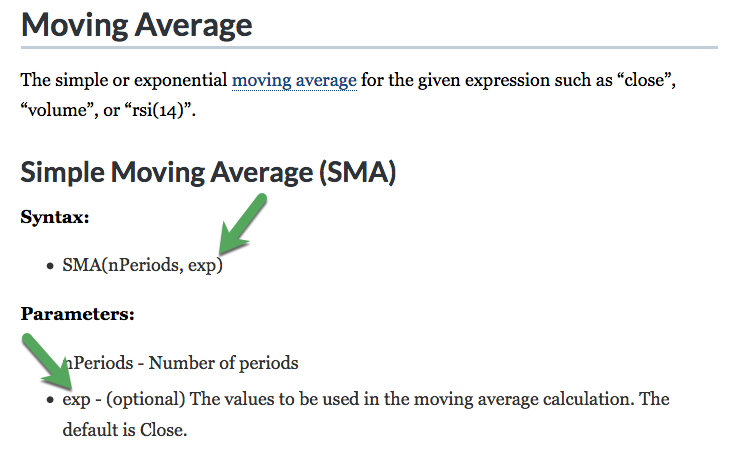
Simple Moving Averages
Double-Smoothed SMAs
In this example, the simple moving average is both overlay and indicator. We are double-smoothing the closing price with two 20-day SMAs.
[SMA(20,SMA(20,close)) > 50]
Bollinger Band Midline Crossover
In this example, the 5-day RSI crosses the midline of its Bollinger Band. The middle of a Bollinger Band is a simple moving average. Thus, for the default 20-day Bollinger Bands, the midline would be a 20-day SMA. This scan clause looks for the RSI to cross its own 20-day SMA.
[RSI(5) x SMA(20,RSI(5))]
Slope
Slope of OBV
In this example, the 10-day Slope of OBV must be greater than zero.
[Slope(10,OBV) > 0.0]
Rank By Slope of ROC
Overlays of indicators can also be used in RANK BY clauses. In this example, we are sorting the scan results by the 10-day Slope of the 20-day Rate of Change.
RANK BY [Slope(10,ROC(20))]
Other Overlays
Remember that while these three overlays (EMAs, SMAs and Slope) are the most popular for use in scans, any technical indicator that has an optional “exp” parameter can be used as an overlay in your scans. Check out the Scan Syntax Reference to find additional indicators that can be used in this way.
Conclusions
Scanning for overlays of indicators is a great way to fine-tune your scan results and more clearly define the desired technical indicator values. These scan clauses can be used to define signal lines to cross over, measure the momentum of an indicator and beyond.
While writing this type of scan clause can seem tricky at first, it is easy once you understand where all the syntax pieces fit in the clause. If you're unsure, try writing the scan clause so that the overlay uses closing price data, then replace “close” with the indicator throughout the scan clause.