Table of Contents
Scan Results Tutorial 2
This tutorial will walk you step-by-step through the process of creating a watchlist of stocks from your scan results. In our previous tutorial, we validated just one stock by launching a chart for that stock. In this tutorial, we will perform more in-depth validation of all stocks in the scan results by saving them in a ChartList and viewing the results in CandleGlance mode. Once the results have been validated and unsuitable stocks have been weeded out, this ChartList can function as a watchlist for stocks you may want to invest in.
Our scanning tutorials assume just a basic knowledge of common technical indicators and chart patterns. This tutorial may build on skills learned in prior scanning tutorials (links are provided where appropriate).
By the end of this tutorial, you will be able to save your scan results in a ChartList, view that ChartList in CandleGlance mode and remove unsuitable symbols from your ChartList. Once you've mastered these skills, be sure to check out our other scanning tutorials to learn about and practice other aspects of scanning.
Tip: We recommend printing out this page so you can refer to it as you follow along on your computer.
Running a Scan
If you are not familiar with the process for running a scan in the Advanced Scan Workbench, we recommend accessing our tutorial on this topic, which will help you build and run the scan listed above.
Step 1:
Run the following scan in the Advanced Scan Workbench:
[type = stock]
and [RSI(14) > 80]
and [country is US]
and [Close > 5]
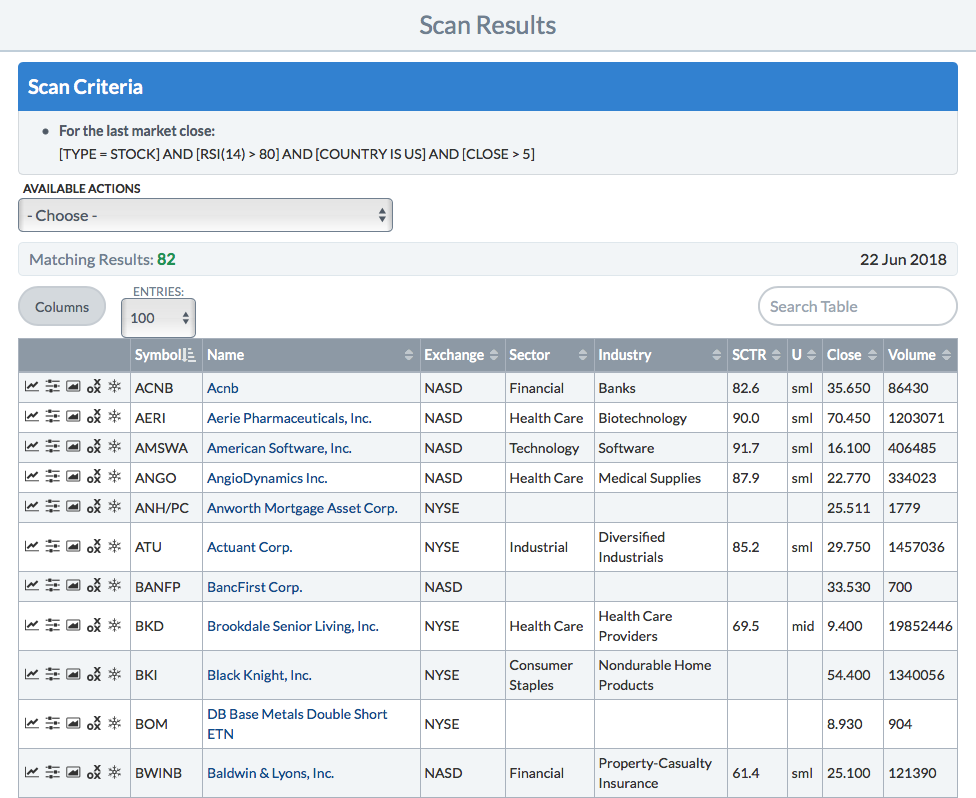
A new browser window (or a new tab in your current browser window) should appear with a results page that looks like the one below.
Storing Scan Results in ChartList
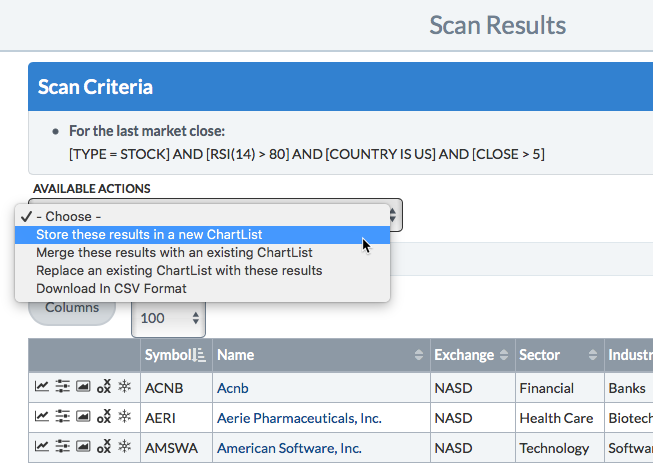
Step 2:
From the “Available Actions” menu, choose “Store these results in a new ChartList”.
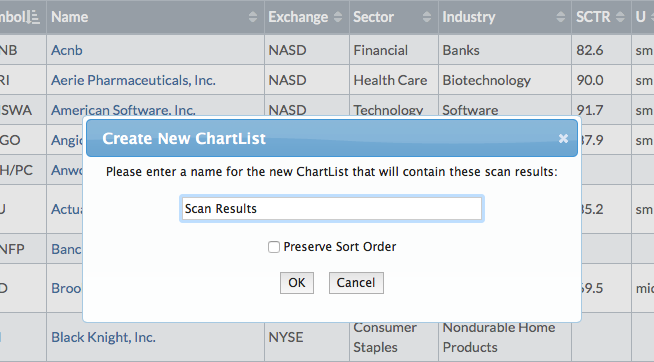
Step 3:
Choose a name for your ChartList and click “OK.” In this tutorial, we will name our ChartList “Scan Results.” If you would like to choose a different name, you can do so.
If you already have a ChartList named “Scan Results” and would like to overwrite it, you can choose “Replace an existing ChartList with these results” in Step 3, then select the “Scan Results” ChartList that you want to overwrite.
Note: ChartLists are limited to 500 charts. If your scan results contain more than 500 symbols, only the first 500 will be added to the ChartList.
Viewing Scan Results in CandleGlance View
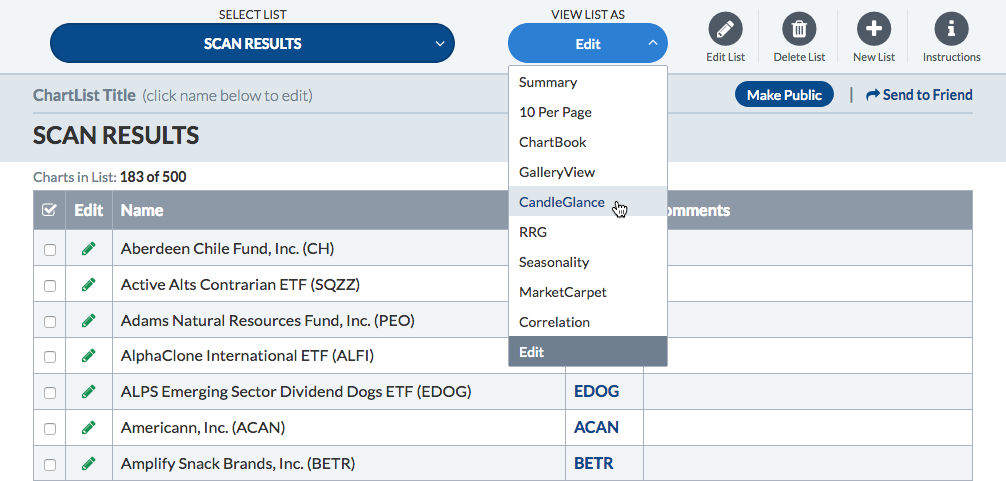
Step 4:
Once your ChartList has been created, it will be displayed in Summary View. To change to CandleGlance View, choose “CandleGlance” from the “View List As” menu above the table.
Step 5:
CandleGlance view displays a mini-chart for each of the symbols in your ChartList. Since we are scanning for RSI values, we want to add RSI as an indicator to the mini-charts. To add this indicator, choose “RSI” from the “Add Indicator” menu. Then click the green “Go” button.
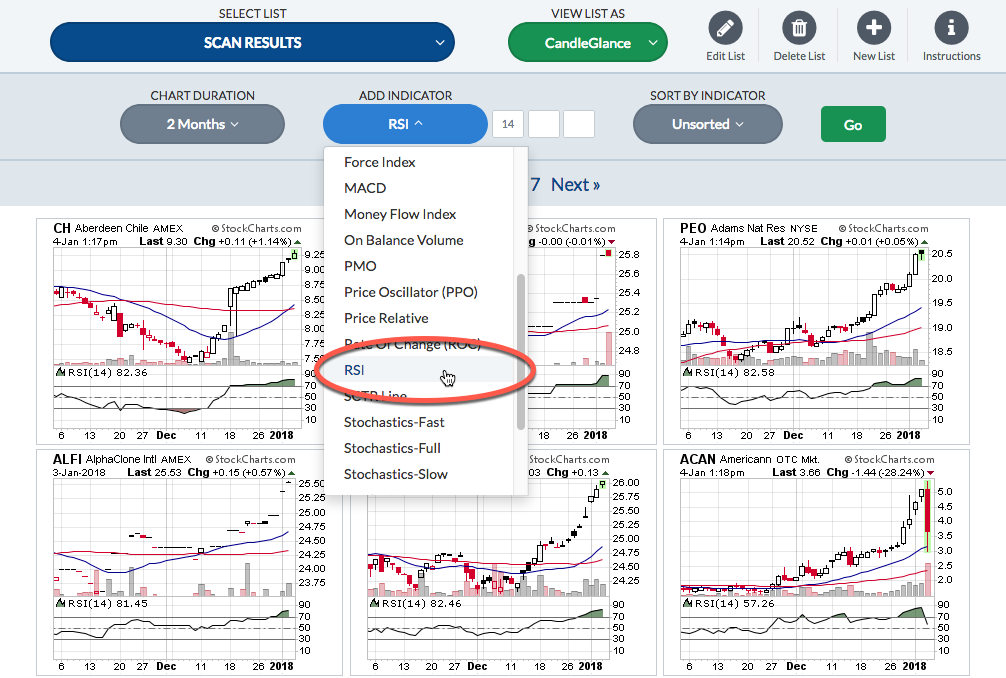
Note: By default, a 14-period RSI indicator is added to the charts. This makes sense in our example, since we scanned for 14-period RSI values, but the number of periods can be changed in the box next to the “Add Indicator” menu if you want to use a different number of periods.
Removing Symbols from the ChartList
Step 6:
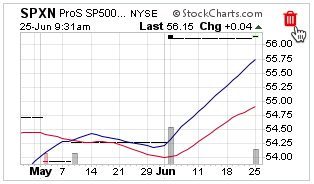
Scan through the mini-charts to see if there are any that don't look appealing to you, despite meeting the RSI value requirement. Perhaps the stock doesn't have adequate liquidity, or perhaps the chart seems to be driven by extreme news. In any case, find one that you would not be interested in investing in. For this example, we have chosen SPXN, which has lower liquidity than we are comfortable with.
Step 7:
To remove this symbol from the ChartList, mouse over the mini-chart until a trash can appears in the upper right corner of the mini-chart. When you mouse over the trash can, it will change from gray to red. Click on the trash can to delete the symbol from the ChartList.
WARNING: clicking the trash can removes the chart immediately; you will not be asked to confirm that you want to delete it. Use this feature with caution!
Note: Once you save your scan results in a ChartList, they become a static list of symbols, completely separate from the results you would get if you ran the scan in the Advanced Scan Workbench again. Thus, symbols on your “Scan Results” ChartList will remain on the ChartList even if their RSI falls below 80 in the future. Similarly, if you delete a symbol from the ChartList, the symbol could still show up the next time you rerun the scan in the Advanced Scan Workbench.
Step 8:
Continue scanning through the mini-charts, removing charts that you are not interested in. Once this process is complete, you will have a watchlist of stocks to research further.
Note: If you are manually removing many similar charts from your ChartList (e.g. stocks that have low volume), you may want to add a clause to your scan to weed out these low-volume stocks earlier on in the process. You can then re-run your scan and replace the results in your ChartList with this more targeted set of scan results.
Learn More
Now that you've mastered working with scan results and creating a watchlist using ChartList functionality, check out our Writing Scans Tutorial to learn more about how to create scans that produce great results.
For more in-depth information on working with scan results, please see our Working with Scan Results article in the Support Center.
Check out our help pages for ChartLists and CandleGlance View to learn more about using those features.