This is an old revision of the document!
Table of Contents
StockChartsACP ChartStyles
Overview
StockChartsACP ChartStyles are collections of chart settings that can be used as “templates” for creating or updating StockChartsACP charts at a later date. A ChartStyle contains all the settings for a chart: period, date range, chart type, color schemes, overlays, indicators, and more. The ChartStyle includes everything except the chart's main ticker symbol.
Saving all these settings in one ChartStyle can speed up your chart creation process. If you find yourself configuring the same settings over and over again for a specific kind of chart (whether you're charting a mutual fund or looking at intraday price action), consider saving those settings as a ChartStyle. In the future, you can apply all those settings to a chart with a single click.
StockCharts members can save up to 50 different ChartStyles in their account, ready to be applied to any ticker symbol. In addition, members can designate a Default ChartStyle which will be used whenever you create a brand-new chart from a ticker symbol.
Predefined StockChartsACP ChartStyles
Most ChartStyles are custom templates created by you, but StockCharts also offers a variety of predefined styles for your use. These sample ChartStyles have been optimized for different trading strategies, chart timeframes, and trading styles. We also offer the ChartStyles of some of your favorite charting experts.
These predefined styles can be used as-is or serve as a starting point for creating your own custom ChartStyles.
Applying ChartStyles in StockChartsACP
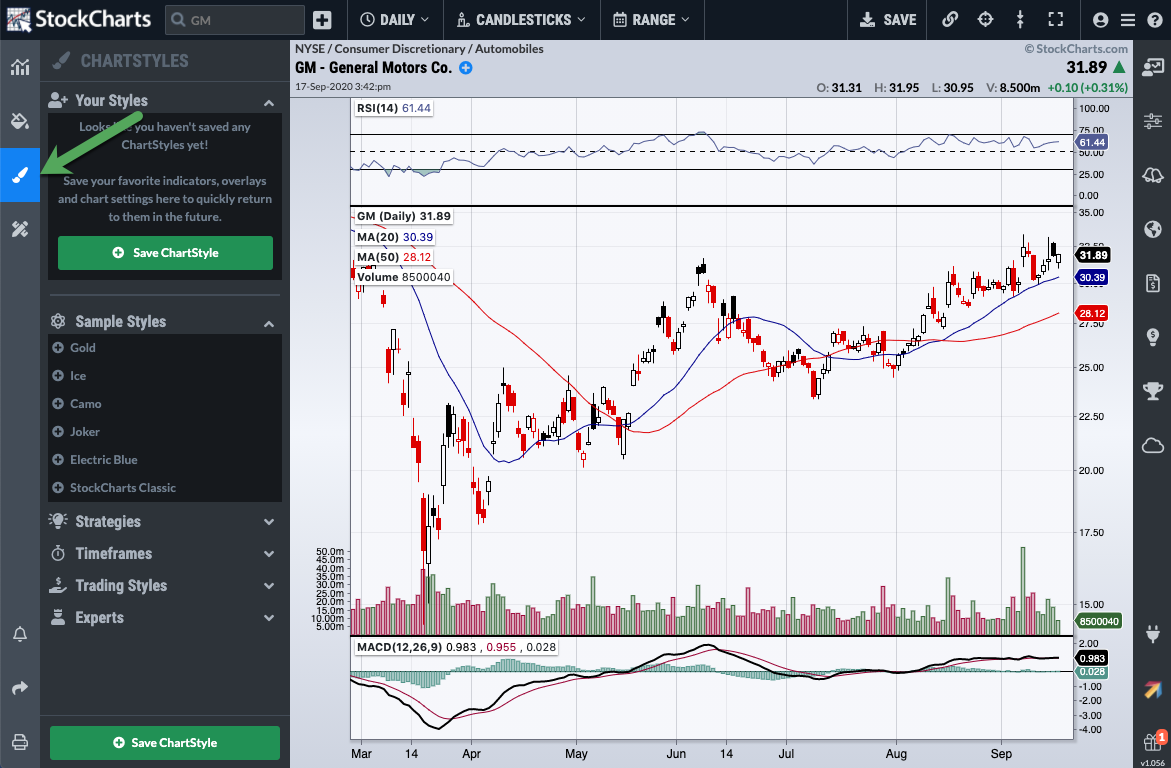
To access both predefined and custom ChartStyles, click on the Paintbrush icon in the Chart Design menu on the left.
Your own custom ChartStyles will be displayed at the top of the panel, and the Predefined styles will be displayed below, grouped into categories.
To apply a ChartStyle to the currently-selected chart, simply click the ChartStyle's name in this panel.
Note: If you're using a multi-chart layout, be sure to click on the chart you want to style before clicking on the ChartStyle name. The currently-selected chart will have a light blue border around the edge of the chart.
Be aware that when you apply a ChartStyle to your chart, there is no ongoing connection between the ChartStyle and the chart where it has been applied. If you apply a ChartStyle to a saved chart and then later change the settings of the ChartStyle, those changes will not automatically be made to the saved chart. The style will need to be reapplied to that chart, and the chart will need to be re-saved to the ChartList.
Creating a New ChartStyle in StockChartsACP
To create your own StockChartsACP ChartStyle, simply configure a StockChartsACP chart with all the desired chart settings, indicators, color schemes, etc., then click the green “Save ChartStyle” button at the bottom of the ChartStyles panel.
You will be prompted to provide a name for your new style:
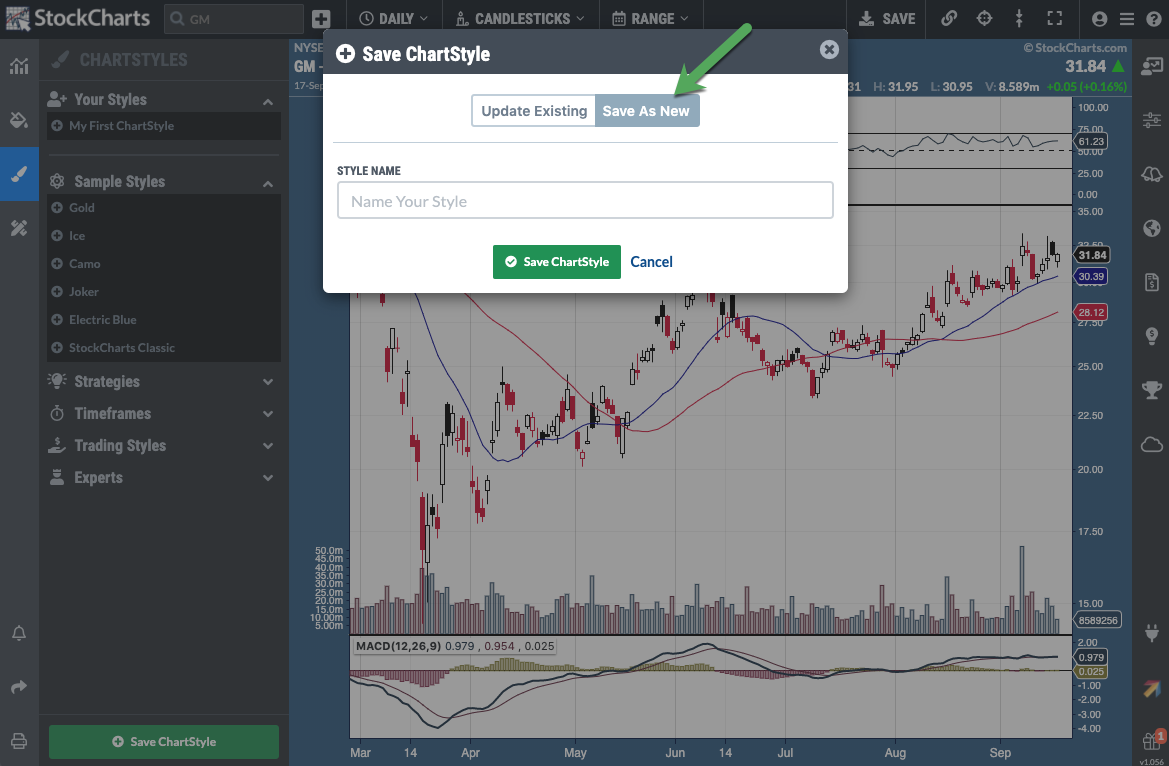
Click the green “Save ChartStyle” button when you are done. Your custom ChartStyles will be listed at the top of the ChartStyles panel.
Modifying ChartStyles in StockChartsACP
Changing Chart Settings for the ChartStyle
Updating the chart settings used in a ChartStyle is as simple as creating a chart that uses that style, configuring the chart with the new settings, then updating the ChartStyle with the settings in that chart.
Once you've updated the chart, click the green “Save ChartStyle” button at the bottom of the ChartStyles panel. In the window that opens, click the “Update Existing” button:
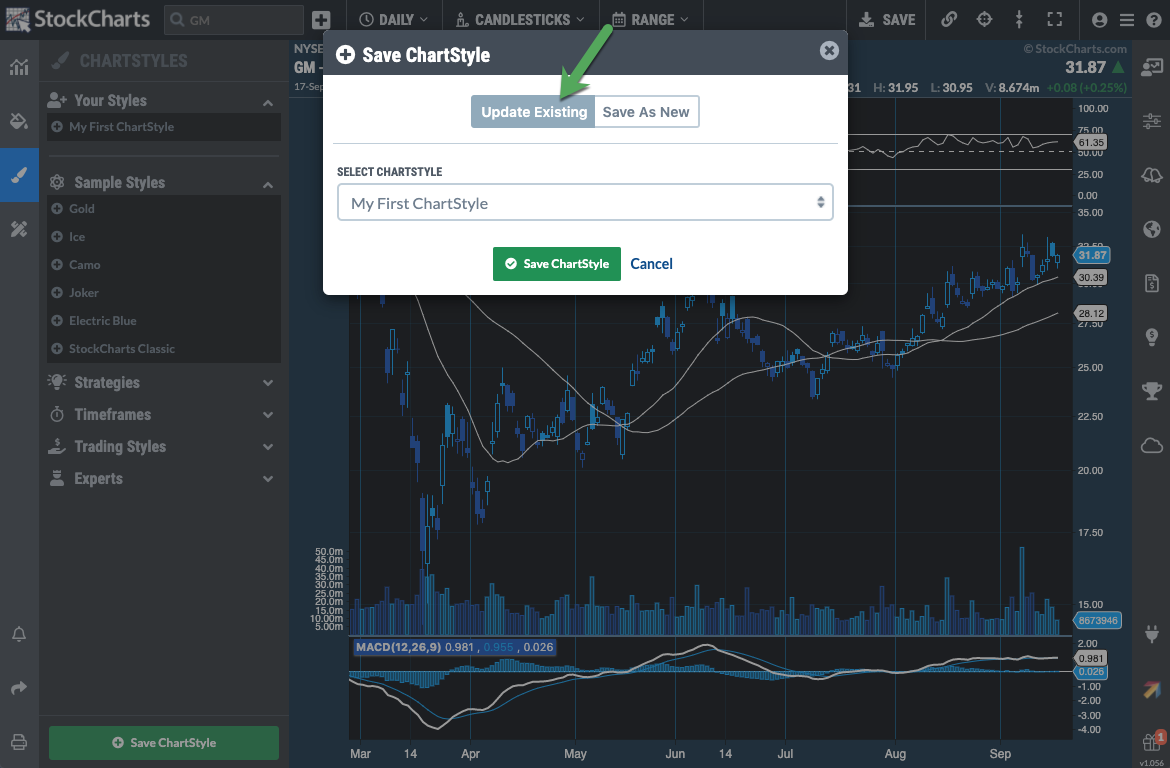
Select the ChartStyle you want to update from the dropdown list, then click the green “Save ChartStyle” button.
Renaming a ChartStyle
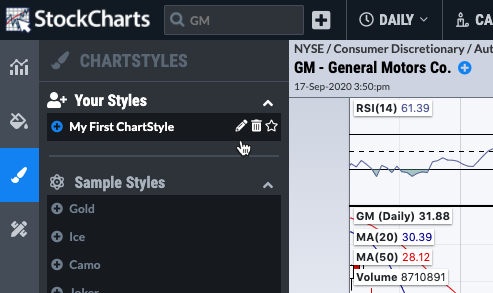
To rename a custom ChartStyle in StockChartsACP, hover over the ChartStyle's name in the ChartStyles panel, and click the pencil icon:
Provide a new name for your ChartStyle and click the green “Save” button.
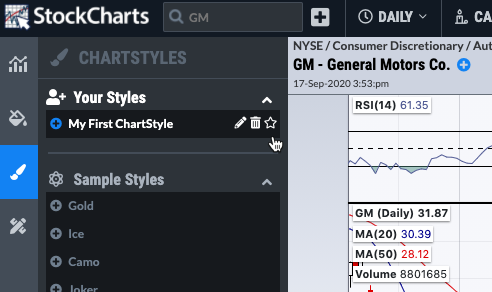
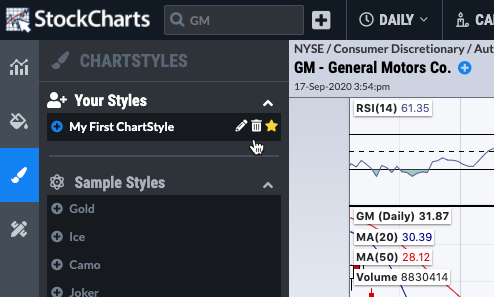
Setting Your Default ChartStyle
To set a different style as your Default ChartStyle, find the new style in the ChartStyles panel and click on the star next to it:
Deleting ChartStyles
To delete a custom ChartStyle in StockChartsACP, hover over the ChartStyle's name in the ChartStyles panel, then click the trash can icon:
You will be prompted to confirm the deletion of your ChartStyle. Click the red Delete button to confirm.