Table of Contents
ChartNotes
Overview
ChartNotes is our premier chart annotation tool, allowing you to add annotations and technical line studies to any SharpChart.
Check out our ChartNotes overview video below, or just read on to learn how to get the most out of ChartNotes.
Creating Annotated Charts
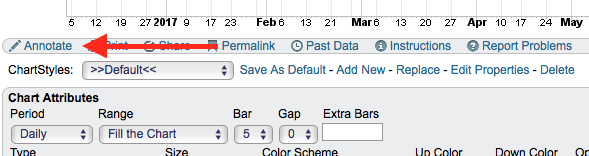
The general process for creating annotated charts consists of creating a SharpChart using the SharpCharts Workbench and subsequently clicking the “Annotate” link below the chart to bring it up inside the ChartNotes annotation tool. We recommend first ensuring your chart's settings are correct before you start annotating it.
Below is a screenshot of the ChartNotes window as it appears while up and running. The collection of tools on the left side of the chart are various drawing tools (described below). The controls along the top of the chart allow you to change the properties of the currently selected annotation.
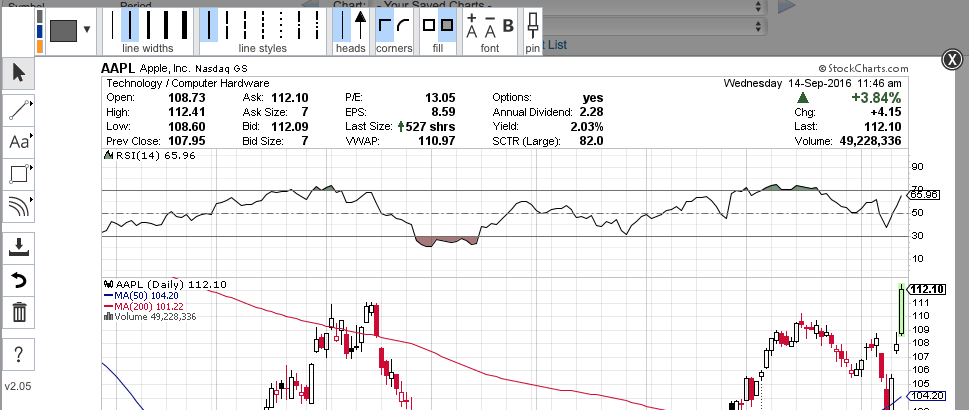
Members can save annotated charts into their account using the “Save” button (the sixth button down on the left side of the ChartNotes window). Once an annotated chart has been saved, its annotations will automatically be repositioned as new data is added to the right side of the chart.
If you want to exit the annotation tool, you can click the black “X” in the upper right-hand corner of the tool. If you have not previously clicked “Save,” a prompt will appear asking if you want to save any changes you have made before exiting.
Working with Annotations
Adding Annotations
Once ChartNotes is running, a row of buttons will appear along the left side of the chart, which will allow you to select a drawing tool. Once the tool is selected, you can click and drag on your chart to add a new annotation to the chart.
Note that some drawing tool buttons have a small triangle in the upper right corner, which you can click to display a slide-out menu containing the tools in that category.
Selecting Annotations
After an annotation is placed on the chart, it can be selected using the “Select” tool.
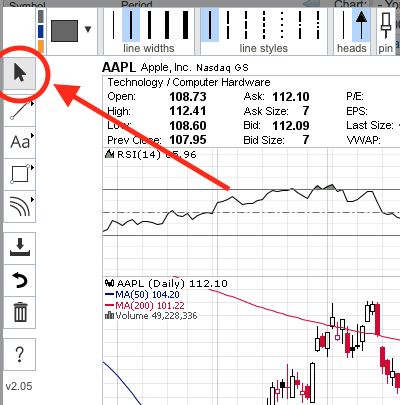
When an annotation is selected, little yellow boxes called “handles” will appear on the outside edges of the annotation. You will also see options for modifying the selected annotation appear in the horizontal menu at the top of the chart.
Once an annotation is selected, you can also cycle through the annotations by pressing the “Tab” key. Pressing Tab + the Shift key will cycle backward through the annotations.
Note: When you are working with another annotation tool, you can temporarily switch to the Selection Tool by holding down the Shift key on your keyboard. While holding down the Shift key, you can select annotations and move them around. Once you release the Shift key, ChartNotes will switch back to the annotation tool you were previously using.
Duplicating Annotations
You can duplicate a selected annotation by pressing CTRL+D (CMD+D on a Mac). Alternatively, you can press and hold the CTRL/CMD key, then click on the annotation and drag your mouse. The new annotation will appear slightly away from the original annotation and will be automatically selected so that you can immediately move or resize it with your mouse.
Note: Some browsers will also display an unrelated dialog box when you press CMD+D. If that happens, just press “Cancel” to dismiss that box.
Creating Channels via Duplicated Trendlines
There is an additional shortcut for quickly creating channel lines on a chart. Start by drawing the upper or lower channel line using the Line tool. Next, press and hold down the CTRL/CMD key on your keyboard. Finally, click and drag on the line you just created. As you drag away from that line, a new parallel line will appear under your mouse. Simply move that line to the top or bottom of your channel and release your mouse button to create the channel.
Deleting Annotations
Once an annotation is selected, it can be deleted by pressing the “Backspace” (or “Delete”) key on your keyboard.
If you want to remove all annotations from a chart, click the “Trashcan” icon on the left-hand side of the ChartNotes window.
The “Undo” icon (reverse arrow just above the trashcan icon) allows you to undo your most recent change to the annotations on the chart. You can undo several changes by clicking the “Undo” button multiple times. You can also press CTRL+Z (CMD+Z on a Mac) to undo an annotation. Please note there is no “Redo” capability - once the change is “undone,” it is gone forever.
Modifying Annotations
Once an annotation is selected, you can click and drag the yellow handles to resize the annotation. To reposition the annotation, click on the center of the annotation and drag.
You can also click on the various options in the horizontal menu at the top of the chart to modify the annotation's attributes. The options that you can change vary depending on the annotation selected. They include:
- Color - The color of the annotation. Clicking the black arrow next to this feature will slide out a menu of color options. Your most recently used 3 colors are always displayed on the far left of the horizontal menu for easy access.
- Opacity - How transparent an annotation is. The opacity slider can be found in the slide out color menu.
- Line Width - Allows you to choose between 5 different line width options.
- Line Style - Allows you to choose between 7 different line style options.
- Arrowhead - Lets you add an arrowhead to a line.
- Corner Type - Allows you to round the corners of the rectangle shape.
- Fill Mode - Lets you toggle between two different approaches for filling in shapes: “Empty” or “Opaque.” “Opaque” mode fills the shape based on the “Opacity” setting (see above).
- Font Size - Two buttons that let you increase or decrease the size of the letters in a text annotation.
- Font Bolding - A button that lets you toggle font bolding on and off.
Pinning Annotations
Typically, annotations are automatically repositioned whenever new price bars are added to the right edge of the chart. There are some situations, however, where you might not want your annotations to be moved. An example would be a block of text that is meant to serve as the chart's title - you might want that text to always remain in the center of the chart.
To prevent an annotation from moving to the left over time, select the annotation with the Select tool and click the “Pin” icon that appears in the horizontal menu at the top of the chart. When that button is depressed (i.e., when it has a light blue background), your annotation will no longer move to the left as new data is added to the chart.
Saving Annotations
The “Save” button (the 6th button down on the left side of the ChartNotes window) is designed to allow you to save annotations as you go.
![]()
When the icon is red, it means that changes have been made that need to be saved. When the icon is black, it means everything is currently saved. It will turn red again if you make any additional edits. This is particularly helpful for users that want to add several annotations at once, so that, if something happens before they are finished, they do not lose all their work.
If you want to exit the annotation tool, you can click the black “X” in the upper right-hand corner of the tool. If you have not previously clicked “Save,” a prompt will appear asking if you want to save any changes you have made before exiting.
If your chart is brand new and has never been saved before, the “Save” button will ask you to name the chart and select the ChartList (if applicable) you would like to save it to before exiting the application.
Non-members cannot save annotated charts to their account (since they do not have an account), but they can use a screenshot tool to create a static snapshot of their annotated chart.
Automatic Annotation Repositioning
Once an annotated chart has been saved into an account, its annotations are automatically repositioned as new data is added to the chart. You can use the “Pin” button - see above - to disable that behavior for an individual annotation. It is important to note that annotations are repositioned based on changes to the vertical and horizontal scale of the chart panel to which they are “attached” (i.e., the panel that contains the geometric middle of the annotation).
Types of Annotations
The annotation tools in ChartNotes are grouped into the following categories. Click on the appropriate link to learn more about each group of tools.
Line Tools
Line Tools are tools that create lines on your chart. Here is a screenshot of where you can find this menu:
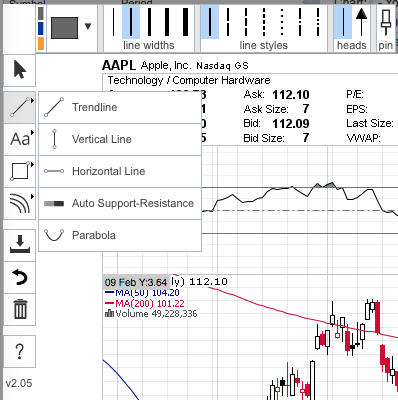
These tools include Trendlines, Vertical Lines, Horizontal Lines, Support/Resistance Lines and Parabolas.
You can watch a video or read more about each individual annotation in our Support Center article on ChartNotes' Line Tools.
Shape Tools
Our Shape tools allow you to create filled or hollow shapes on your chart. Here is a screenshot of where you can find this menu:
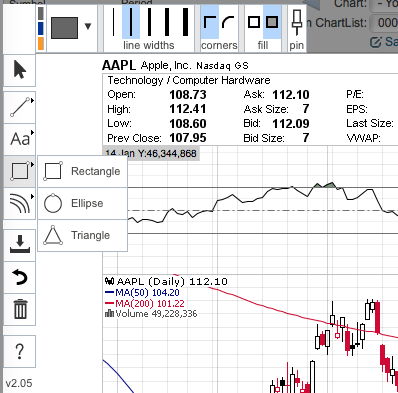
These tools include includes Rectangles, Ellipses and Triangles.
You can watch a video or read more about each individual annotation in our Support Center article on ChartNotes' Shape Tools.
Text Annotations
Our Text Annotation tools allow you to add text to your chart. Here is a screenshot of where you can find this menu:
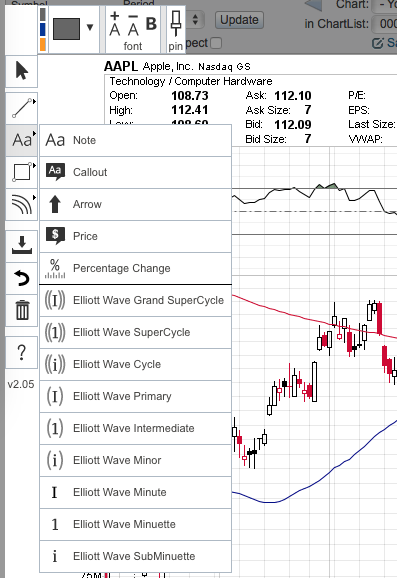
These tools include Text Notes, Callout Boxes, Arrows, Price Boxes, Percentage Change and Elliott Wave Labels.
You can watch a video or read more about each individual annotation in our Support Center article on ChartNotes' Text Annotations.
Line Studies
We also offer additional Line Study tools. Here is a screenshot of where you can find this menu:
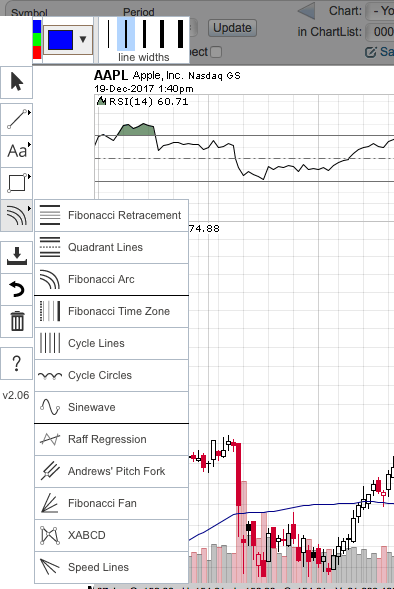
These tools include Fibonacci Retracements, Quadrant Lines, Fibonacci Arcs, Fibonacci Time Zones, Cycle Lines, Cycle Circles, Sinewaves, Raff Regression Channels, Andrews' Pitch Forks, Fibonacci Fans, Harmonic Patterns (XABCD) and Speed Resistance Lines.
You can watch a video or read more about each individual annotation in our Support Center article on ChartNotes' Line Study Tools.
Tips and Tricks
Ready for advanced ChartNotes? Watch our ChartNotes Tips and Shortcuts video and take your ChartNotes skills to the next level.
Additional Resources
Articles
Frequently Asked Questions
Q: Why do my annotations shift in ChartNotes?
A: Our annotation system automatically “snaps” your annotation locations to the center of the closest bar/candlestick. That allows us to automatically update your annotations as new bars are added to the right side of the chart, but it has the disadvantage of causing annotations to shift from wherever you placed them to the center of the nearest candle. This is especially noticeable when you have large/wide candles.
To avoid this shifting, you'll need to either add more candles to your chart or reposition your annotations so that they line up with the center of your candles.
Q: Why are new annotations appearing on the far right side of the chart, regardless of where I place them?
A: This can happen if your browser window is zoomed in or out while you are using ChartNotes. Please ensure that your browser zoom level is set to 100% before entering ChartNotes.
Q: Where can I find the Open, High, Low and Close values in ChartNotes?
A: Hover your cursor over the bar you want to see the price for to show the date and OHLC values at the bottom of the chart along the x-axis, as well as volume and the current position of the cursor on the y-axis (price).
Next Up » Other Charting Tools