Table of Contents
Writing Percent Change Scans
When scanning for stocks that have made big moves, it is smart to measure those moves as a percentage rather than a flat value. A $5 price change is huge for a $10 stock, but barely noticeable on a $1000 stock. Our PctChange() scan function makes these types of scans a breeze, but it can also do much more. Let's take a closer look.
Adding a Percent Change Clause
To add a Percent Change clause to your scan, go to the Advanced Scan Workbench. From the “Technical Indicators” menu in the Scan Components area, choose “PctChange” and click the “Add” button.
By default, the scan clause looks like this:
[PctChange(10,close) > 10]
The first parameter for the PctChange() function shows the number of periods in the timeframe that you're measuring. The second parameter tells the scan engine what set of data to use for the calculations. By default, the clause uses daily close data, calculating the percentage change of the daily closing values over the last 10 days.
To scan using a different set of data (volume, MACD Line, etc.), simply replace “close” in the scan clause with another expression. For example, the following clause scans for stocks where the Bollinger Band Width has increased by more than 10% over the last 5 days:
[PctChange(5,BBWidth(20,2)) > 10]
The percent change is calculated by taking the difference between the value today and the value on the specified number of days ago, dividing it by the value on the earlier date and multiplying the result by 100.
The following two scan clauses are equivalent, but the PctChange one is much simpler to write:
[[[today's close - 10 days ago close]/[10 days ago close]]*100 > 7]

[PctChange(10,close) > 7]
Scanning for Big Moves
PctChange() is commonly used to scan for large changes (either up or down) in price, volume or indicator values over a period of time.
The following example clause scans for securities whose closing price has increased by at least 7% over the last 10 days:
[PctChange(10,close) > 7]
To look for large drops, simply compare to a negative number. This clause scans for securities whose closing price has decreased by at least 7% over the last 10 days (where the percentage change is less than -7%):
[PctChange(10,close) < -7]
Remember that PctChange() isn't just for price data. It can also be calculated for MACD, moving averages, BB Width, volume - virtually anything available on the “Price, Volume & SCTRs” or “Technical Indicators” menus in the Advanced Scan Workbench. The following clause looks for securities whose RSI value has dropped by at least 20% over the previous 10 days.
[PctChange(10,RSI(14)) < -20]
A Note on Oscillators
Calculating percentage change can result in some unexpected numbers when you are dealing with values close to zero. For example, when you're looking at a penny stock, a price increase of one cent could easily be a 100% change in price.
Oscillators like the MACD, which oscillate around the zero line, run the same risk. If your indicator value is near 0 and changes by just a very small amount, the percentage change could be enormous. For example, a change from 0.01 to 0.03 is a 200% increase.
When scanning for the percentage change of oscillators, it is especially important to manually review the results of your scan. A quick glance at the chart for each symbol in your results will quickly tell you whether or not they are of further interest. If you're getting a large number of irrelevant scan results, you may need to adjust your scan parameters or refine your scan with additional clauses.
Ranking Within a Group
We can also use the PctChange() function in RANK BY clauses, as shown below:
[group is DOW30]
RANK BY [PctChange(20,close)]
The example above shows all the stocks in the Dow Jones Industrial Average, ranked by their percentage price change over the last 20 days.
This technique can be used for all kinds of “groups,” including indexes, exchanges and even your own ChartLists.
Scanning for Comparison to a Benchmark
Percent Change clauses can also be used to compare values to a benchmark. For example, let's say we want to know which S&P 500 stocks are outperforming the S&P 500 index over the last 50 days.
This example requires two scans. First, we scan to find out the percentage change of the S&P 500 itself:
[symbol = '$SPX']
RANK BY [PctChange(50,close)]
This scan will return one result ($SPX) and the RANK BY clause will display the value for the 50-day percent change for $SPX:
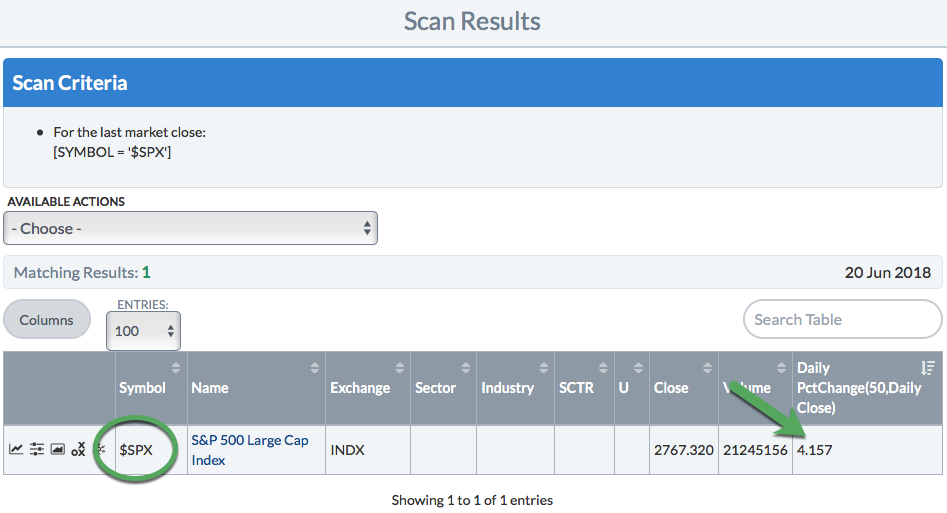
The 50-day percent change for $SPX (in this example, 4.157) can be plugged in to a second scan to show which S&P 500 stocks are outperforming the $SPX:
[group is SP500]
and [PctChange(50,close) > 4.157]
This second scan will show all the stocks in the S&P 500 that have a higher 50-day percent change than $SPX itself.
Note that the $SPX percent change will fluctuate on a daily basis, so you will need to scan to get the current value and update your second scan with that value every time.
Learn More: Scanning for Relative Strength
Conclusions
The PctChange() function is traditionally used to scan for noteworthy changes in price, but it can be used to determine the percentage change of almost anything, including volume or indicator values. This versatile function is not only used to find sharp increases or decreases, but can also be used to compare to a benchmark or rank within a group.