Scanning for Selling Climaxes
A selling climax occurs when a stock falls sharply on extremely high volume. As the name infers, a selling climax suggests that selling pressure has peaked and traders should expect some sort of rebound. Think of this selling pressure as a stretched rubber band, which cannot stretch forever. At some point, the rubber band either breaks or snaps back. In chart terms, a rubber band break would be the equivalent of a complete meltdown in prices, whereas a snap back implies an oversold bounce that retraces a portion of the prior decline.
Chartists can scan for stocks that have experienced selling climaxes that could give way to oversold bounces. Though not perfect, the scan criteria below are designed to find stocks that became oversold on high volume and are still trading near their lows. Chartists can copy and paste this code into the Advanced Scan Workbench.
[type = stock] AND
[country = US] AND
[Daily SMA(20,Daily Close) > 10] AND
[Daily SMA(20,Daily Volume) > 40000] AND
[Daily SMA(2,Daily Volume) > Daily SMA(250,Daily Volume) * 2] AND
[BB Width(10,2) > Daily SMA(250,BB Width(10,2)) * 2] AND
[Daily MIN(5,RSI(14)) < 25] AND
[Fast Stoch %K(14,3) < 10]
The first four lines simply define the universe of symbols that are of interest. In this example, we are scanning for US stocks with a 20-day price average above $10 and a 20-day volume average above 40,000 shares.
[Daily SMA(2,Daily Volume) > (Daily SMA(250,Daily Volume) * 2)]
Line five of the example looks for stocks where the average volume of the last two days is at least twice the 250-day average for volume. This ensures extremely high volume.
[BB Width(10,2) > Daily SMA(250,BB Width(10,2)) * 2]
Bollinger Band Width is a measure of volatility. In this example, we are looking for the shorter-term BB Width (10,2) to be at least twice the 250-day average of BB Width (10,2), which ensures that we have seen an expansion in volatility.
[Daily MIN(5,RSI(14)) < 25]
Line seven looks for stocks where the 14-day RSI dipped below 25 at some point in the last five days. This ensures that the stock moved lower and became oversold over a 14-day period, not just for a few days. Note that 30 is normally used for oversold readings. Using 25 ensures an extra degree of oversold-ness.
[Fast Stoch %K(14,3) < 10]
Line eight looks for stocks where the Fast Stochastic Oscillator is below 10. The Stochastic Oscillator measures the level of the close relative to the high-low range over the last fourteen days. A Stochastic Oscillator value below 10 ensures that the current close is near the low end of this range. This last criterion is used to cancel out stocks that have already bounced.
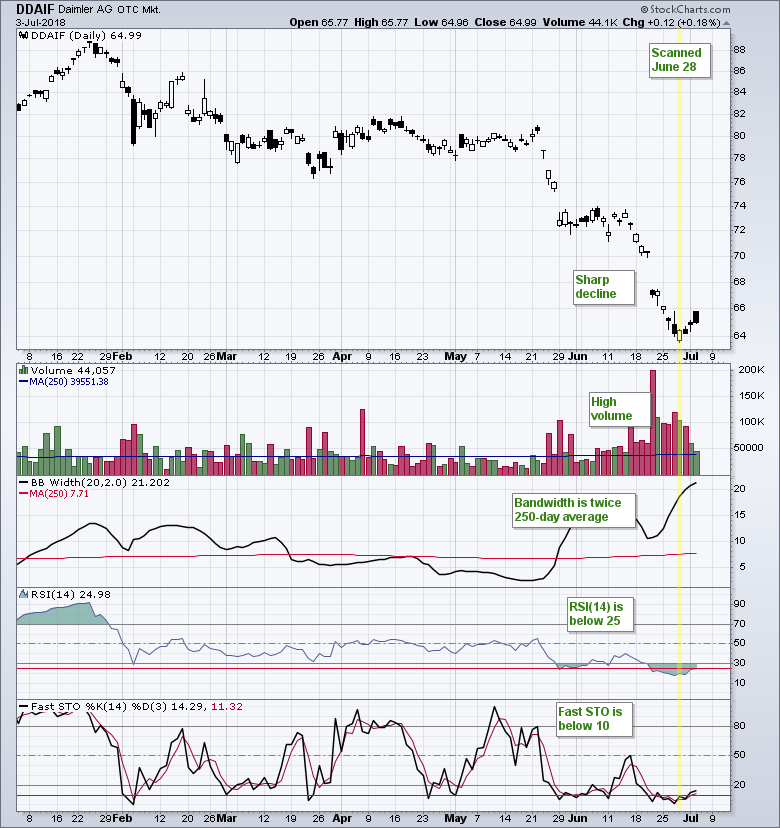
The chart above shows Daimler AG (DDAIF) meeting these scan requirements on June 28, 2018.
Keep in mind that the selling climax scan in this article is just an example. Chartists should adjust their own scans to suit their personal trading style.