Table of Contents
ChartStyles and StyleButtons
Overview
It is common to use different indicators and parameter settings when changing from a 1-minute chart to a daily or monthly chart. Similarly, different indicators and chart settings might be used when viewing charts for different asset types, such as mutual funds, commodities or currencies. Changing all of these chart settings with each chart you create takes time, so many users choose to create ChartStyles instead.
ChartStyles are collections of SharpCharts settings that can be used as “templates” for creating new charts later. A ChartStyle contains all of the settings that you see below the chart on the SharpCharts Workbench page - the chart's period, date range, size, type, colors, overlays, indicators, etc. In fact, a ChartStyle contains everything about a SharpChart except for its main ticker symbol.
By themselves, ChartStyles are not usable - they must be “applied” to a specific ticker symbol in order to create a usable SharpChart. The combination of chart settings and ticker symbol data are used to quickly create the SharpChart.
Any time you find yourself configuring the same chart settings over and over again with different ticker symbols, consider saving that configuration in a ChartStyle that can be reused again and again. Members can save up to 50 different ChartStyles in their account, ready to be applied to any ticker symbol.
Additionally, members can assign up to 12 different ChartStyles to thin, gray “StyleButtons” that appear to the left of the chart on the SharpCharts Workbench. StyleButtons allow you to quickly apply your most commonly-used ChartStyles with a single click.
Note: While this article is focused on ChartStyles for SharpCharts, the P&F Workbench also offers some ChartStyle functionality.
Special ChartStyles
Most ChartStyles are custom templates created by the user, but there are some special kinds of ChartStyles that are worth mentioning.
Default ChartStyle
The Default ChartStyle is a special collection of settings that are used whenever you ask us to create a new chart from a ticker symbol. Examples include:
- Typing a ticker symbol into the “Create a Chart” box and pressing “Go.”
- Clicking on a symbol in the Ticker Cloud.
- Clicking on a symbol in the Market Movers panel on Your Dashboard.
- Clicking on a symbol in one of the Summary reports.
- Clicking on a symbol in a Scan Results list.
- Etc.
Your Default ChartStyle should have the settings you find most useful when first looking at a new stock.
Please see the Editing ChartStyles section below for detailed instructions on setting up your Default ChartStyle.
Tool-Specific ChartStyles
You can create special ChartStyles that will be used with specific StockCharts tools. For example, you can create a ChartStyle named “CandleGlance” which will be used whenever you display a CandleGlance chart. Effectively, this creates a default ChartStyle for that tool.
Tool-specific ChartStyles are currently available for CandleGlance, GalleryView (intraday, daily and weekly only), Market Summary and Industry Summary charts. Please see our Tool-Specific ChartStyles article in the Support Center for detailed instructions on setting up your tool-specific ChartStyles.
Predefined ChartStyles
Predefined ChartStyles are ChartStyles provided by StockCharts for your use. The first few Predefined ChartStyles are very basic and are intended as starting points for you to create your own custom ChartStyles. The rest of the Predefined ChartStyles are associated with top analysts, reflecting their favorite indicators and chart settings. Predefined ChartStyles can be applied to your charts, but cannot be edited by you.
ChartPack ChartStyles
Similar to Predefined ChartStyles, the ChartStyles included in certain ChartPacks are typically created by analysts to show the chart settings they use. However, these ChartStyles are installed to your account much as custom ChartStyles are, meaning they can be modified by you.
Accessing ChartStyles and StyleButtons
There are two main areas on the SharpCharts Workbench where you can manage your ChartStyles and StyleButtons.
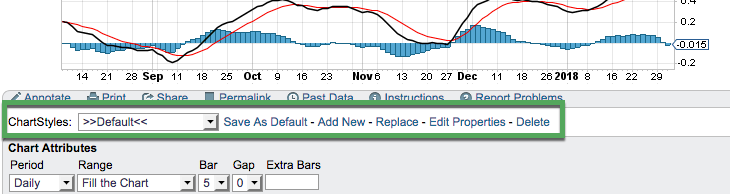
ChartStyles Area
You can see the ChartStyles Area below the chart in the SharpCharts Workbench. Use the dropdown menu in this area to select a ChartStyle to apply to the current chart. The links to the right allow you to make changes to your ChartStyles and StyleButtons.
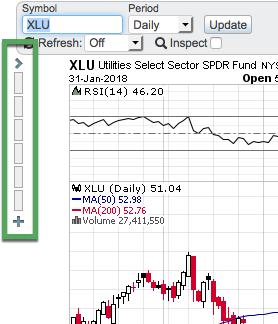
StyleButtons Area
To the left of the chart, you will see the StyleButtons Area: a small arrow icon pointing to the right, a plus sign icon and possibly some small gray rectangles. These small grey rectangles are your StyleButtons, and the arrow and plus sign allow you to manage both your StyleButtons and your ChartStyles.
ChartStyles and StyleButtons go hand in hand and, in fact, most of the style settings can be changed from either area. In the rest of the article, we'll go into more detail about using both of these areas to manage your style settings.
Applying ChartStyles
When you apply a ChartStyle to your chart, the settings from the ChartStyle are combined with the ticker symbol from the existing chart to create a brand new, independent chart. Thus, if you're looking at a saved AMZN chart and apply a ChartStyle with the “Night” color scheme and has a MACD indicator below the price panel, a brand new AMZN chart with said color scheme and indicator will be created. This new chart can be saved into your ChartList, either as a new saved chart or overwriting the existing saved AMZN chart.
It is important to understand that there is no ongoing connection between the ChartStyle and the chart where it has been applied. For example, if you later change that ChartStyle to use the “Spruce” color scheme instead, no changes will be automatically made to the color scheme of your saved chart. You would need to re-apply the ChartStyle to your chart in order to update its style settings.
There are multiple ways to apply a ChartStyle to an existing SharpChart, described below:
From the ChartStyles Area
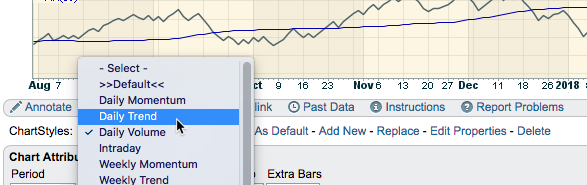
Choose the ChartStyle you want to apply from the dropdown menu in the ChartStyles Area. Your custom-created ChartStyles are listed in this menu, followed by the Predefined ChartStyles provided by StockCharts.
Using the StyleButtons
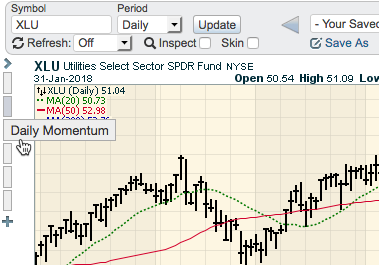
For those ChartStyles that have been assigned StyleButtons, you can click the StyleButton to the left of the chart that corresponds to the ChartStyle you want to apply.
From the StyleButtons Menu
Click the arrow icon next to the StyleButtons to the left of the chart, then choose the ChartStyle you want to apply from the menu that appears. Your custom-created ChartStyles (with and without StyleButtons) are listed in this menu, followed by the Predefined ChartStyles provided by StockCharts.

(Note that a tiny preview image is displayed next to each ChartStyle.)
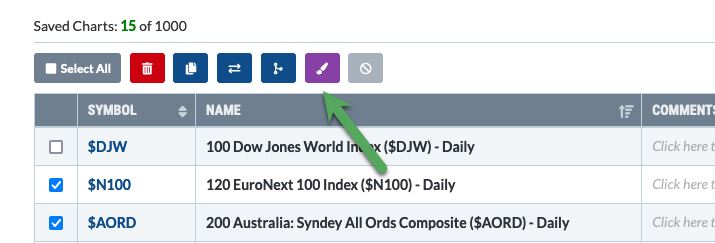
From the Edit View of a ChartList
You can also apply your ChartStyle to some or all of the charts in a ChartList at one time, using the Edit View of one of your ChartLists. See our Edit View help page in the Support Center for more information on this method.
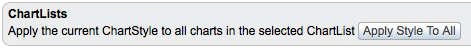
Applying to a ChartList from the SharpCharts Workbench
In addition to applying saved ChartStyles, you can also “copy” the current style from one chart in your ChartList to all the other charts in that same ChartList. This can be done from the SharpCharts Workbench:
- Select the ChartList that you want to modify from the ChartList dropdown at the top of the page.
- Change the settings on the ChartList that is loaded in the workbench until it looks the way you want the rest of the charts in the ChartList to look. Be sure to click Update after making the changes.
- Click the “Apply Style to All” button near the bottom of the workbench.
Creating ChartStyles
In the previous section, we learned about applying ChartStyles. Now it's time to learn about creating your own ChartStyles, customized to meet your analysis requirements.
The first step in creating a ChartStyle is to create a SharpChart and change its settings to match your requirements. These list of potential settings includes period, range, chart type, color scheme and more. Additionally, you can configure any indicators or overlays that you want on the chart. Be sure to click Update once you are finished making changes.
Once your chart is configured the way you want, you can save those settings as a ChartStyle from either the ChartStyles Area or the StyleButtons Area.
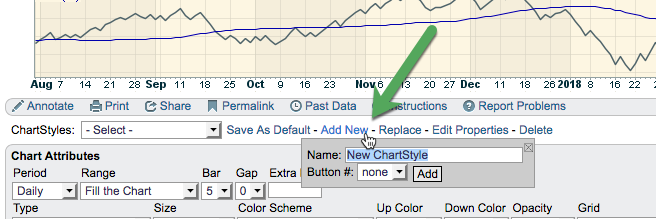
Saving from the ChartStyles Area
- Click the “Add New” button in the ChartStyles area.
- Enter a name for your new ChartStyle in the “Name” box.
- Click the “Add” button.
Saving from the StyleButtons Area
- Click the plus icon below the StyleButtons.
- Enter a name for your new ChartStyle where it says “ChartStyle Description.”
- Click the “Add New” button.
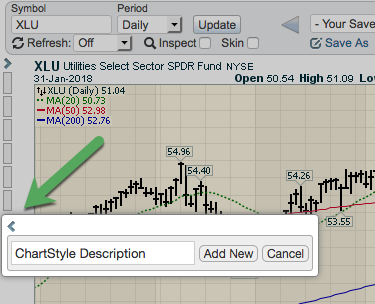
Note: When you save a new ChartStyle from the StyleButtons Area, a StyleButton will be automatically created for the new ChartStyle.
Editing ChartStyles
Changing Chart Settings
Updating the chart settings used in a ChartStyle is as simple as making changes to a chart with that style and replacing the current ChartStyle with the settings in your updated chart.
As with creating a ChartStyle, the first step is to create a SharpChart and change its settings to match your requirements. We recommend that you first apply the existing ChartStyle to your chart, then make your changes from there.
Once your chart is configured the way you want, you can replace the existing ChartStyle with these new settings from either the ChartStyles Area or the StyleButtons Area.
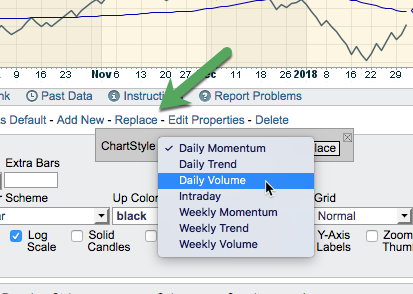
Updating from the ChartStyles Area
- Click the “Replace” link in the ChartStyles Area.
- From the dropdown menu, choose the ChartStyle you want to replace with these settings.
- Click the “Replace” button.
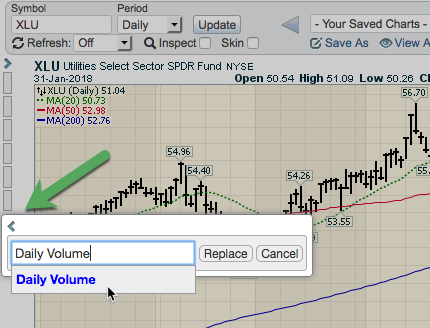
Updating from the StyleButtons Area
- Click the plus icon below the StyleButtons.
- In the box labeled “ChartStyle Description,” begin typing the name of the current ChartStyle that you want to replace.
- A list of matching ChartStyle names will appear below the box. Select the one you want to replace.
- Click the “Replace” button.
Remember, making changes to the ChartStyle won't affect the settings for any charts that have previously had that ChartStyle applied.
Renaming a ChartStyle
From time to time, you may want to rename one of your ChartStyles.
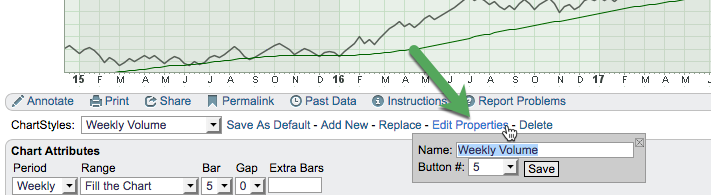
Renaming from the ChartStyles Area
- Select the ChartStyle you want to rename from the dropdown menu in the ChartStyles Area.
- Click the “Edit Properties” link in the ChartStyles Area.
- Type in the new name for the ChartStyle.
- Click the “Save” button.
Renaming from the StyleButtons Area
- Click the arrow icon in the StyleButtons Area.
- Click the “Edit” button at the top of the menu.
- Find the ChartStyle you want to rename in the menu, and type in a new name for it.
- Click the “Done” button at the top of the menu.
Setting the Default ChartStyle
The Default ChartStyle is the one that is used whenever you create a brand new SharpChart. This ChartStyle should include the settings and indicators that you most want to see when first looking at a new ticker symbol.
Note: We recommend using a “Range” setting of “Fill the Chart” for your Default ChartStyle. The Range setting “Select Start/End” is specifically not recommended.
Once you have created the ChartStyle that you want to use, setting it as your default ChartStyle is simple to do.
Setting the Default ChartStyle from the ChartStyles Area
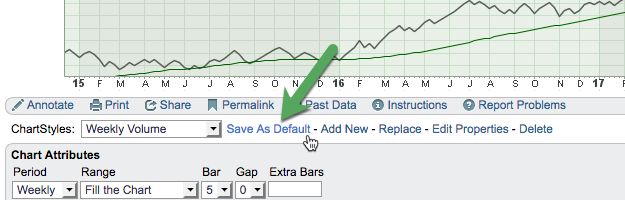
- Select the ChartStyle you want as the default from the dropdown menu in the ChartStyles Area.
- Click the “Save As Default” link in the ChartStyles Area.
- Click “OK”“ to confirm that you want to change it.
Setting the Default ChartStyle from the StyleButtons Area
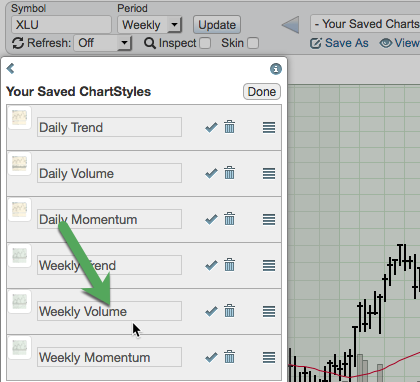
- Click the arrow icon in the StyleButtons Area.
- Click the “Edit” button at the top of the menu.
- Find the ChartStyle you want to use as your Default ChartStyle, and click the checkmark icon next to it.
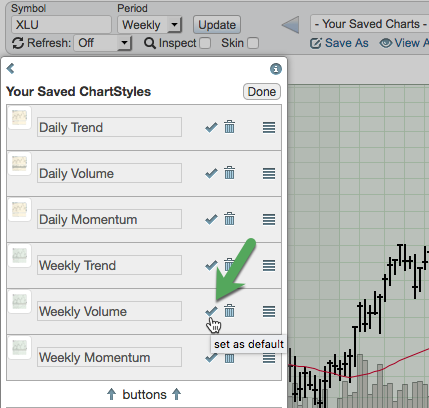
Note: there is no confirmation popup when making this change in the StyleButtons Area. The default ChartStyle is changed as soon as you click the checkmark icon.
Deleting ChartStyles
If you no longer need a ChartStyle and wish to remove it from your account, you can do that from either the ChartStyles Area or the StyleButtons Area.
Deleting from the ChartStyles Area
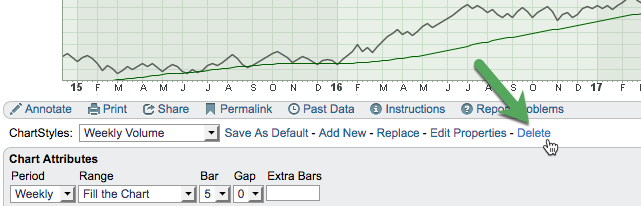
- Select the ChartStyle you want to delete form the dropdown menu in the ChartStyles Area.
- Click the “Delete” link in the ChartStyles Area.
- Click “OK” to confirm that you want to delete it.
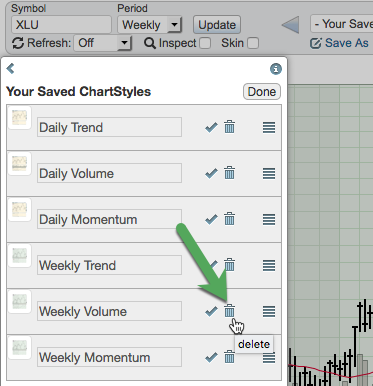
Deleting from the StyleButtons Area
- Click the arrow icon in the StyleButtons Area.
- Click the “Edit” button at the top of the menu.
- Click the trash can icon next to the ChartStyle you wish to delete.
- Click “Yes” to confirm that you want to delete it.
Managing StyleButtons
The best way to manage your StyleButtons is from the StyleButtons Area. Clicking the arrow icon will open a menu that will allow you to easily add or remove StyleButtons, as well as change the order that they appear in on the SharpCharts Workbench.
When you click the arrow icon in the StyleButtons Area, you will see a menu similar to this:
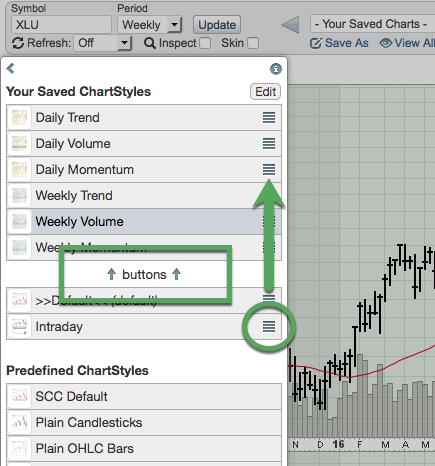
Notice the “buttons” line that has two arrows pointing up. Any ChartStyles listed above this line will have StyleButtons, any below the line will not.
To move a ChartStyle, click and drag on the striped icon to the right of the ChartStyle. When it has been moved to its desired location, release the mouse button and the location will be updated.
To add a StyleButton for a ChartStyle, click and drag the striped icon for the ChartStyle above the buttons line. The buttons on the SharpCharts Workbench will be displayed in the same order that they are on this list, so if you want that ChartStyle to appear as the third button on the workbench, click and drag it to the third position on this list.
To remove a StyleButton for a ChartStyle, simply click and drag it below the buttons line. The ChartStyles below the line will always be listed in alphabetical order, regardless of where you drag and drop it.
The third section of this list contains Predefined ChartStyles. These cannot be dragged above the buttons line, but they are listed here so that you can click on one of them to apply that ChartStyle to your chart.
Hint: If you really want a StyleButton for one of these Predefined ChartStyles, you can apply it to a chart and then save a “copy” of those settings as a new custom ChartStyle. Custom ChartStyles can be dragged above the buttons line to create a StyleButton.
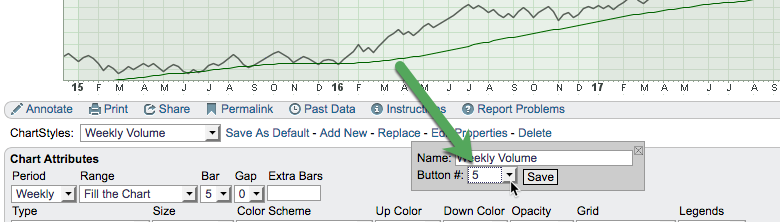
Managing StyleButtons from the ChartStyles Area
While the StyleButtons Area is strongly recommended for managing your StyleButtons, you can make changes from the ChartStyles Area. Choose the ChartStyle you are interested in from the dropdown menu in the ChartStyles Area, then click the “Edit Properties” link. In the “Button #” dropdown menu, you can choose which StyleButton number you want for this ChartStyle (e.g. for the third button, choose “3” from this menu). If you choose “none,” the ChartStyle will have no StyleButton. Once you've made your selection, click the “Save” button.
Conclusion
ChartStyles and StyleButtons help to streamline the analysis process, allowing you to quickly switch between different chart styles for a single ticker symbol. Those charts might cover different time periods or be focused on different aspects of technical analysis. Once you've determined the important settings, indicators and overlays for each chart, you can quickly create a chart with that exact configuration for any ticker symbol you choose.
Additional Resources
SharpCharts In Focus
The following StockCharts In Focus video, “Streamline Your Charting Workflow with ChartStyles”, takes a deep-dive into ChartStyles for both SharpCharts and StockChartsACP. The coverage of SharpCharts ChartStyles starts at 4:00.