Table of Contents
Scheduling Your Scan
Running your scans manually can be a drag especially if you run them every day. We've made the process super easy. With the Scheduled Scans feature in StockCharts, you can schedule your scan to run at a certain time each day. You can save the scan results to a new or existing ChartList. That too is an easy process—you receive an email with a list of the scan results and a link to view your results in your ChartLists. All you have to do is click a button.
How to Access Scan Results
There are several ways to access scan results. You can access it from the Charts & Tools tab or from Your Dashboard. Both paths are similar, but we'll show you how to access the scan results from Your Dashboard.
From Your Dashboard, select the “Scheduled Scans” link in the “Member Tools” section or select the “More” button in the “Your Scans” section of the page and choose “Scheduled Scans.” Note: you can also access Scheduled Scans from the advanced Scan Workbench by selecting the Scheduled Scans tab at the top of the workbench.
On this page, you can schedule new scans and view/manage existing scans.
How to Schedule Scans
The process involves four simple steps:
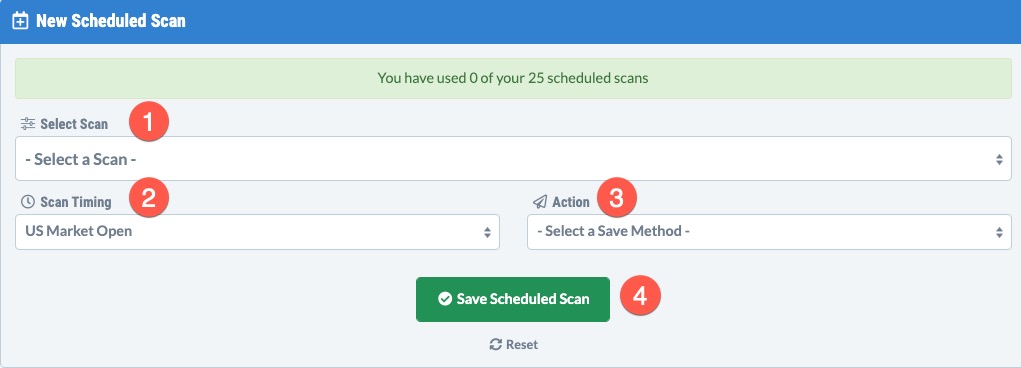
- Select the saved scan you would like to schedule from the Select Scan dropdown menu.
- Select when you would like to run the scheduled scan from the Scan Timing dropdown menu (the open or close of supported markets or choose a custom time).
- From the Action dropdown menu, choose whether you want to save the results in a new ChartList or overwrite or merge with an existing ChartList).
- Once you've selected your parameters, select the green Save Scheduled Scan button.
Your scheduled scan will now run automatically at the time you specified and the results will be saved in the SharpCharts or ACP ChartList you specified. You'll receive an email with a link to the ChartList. All you have to do is select the link to view the scan results.
Viewing Your Scheduled Scans
The Your Scheduled Scans section of the page will show all the scans you've scheduled in a table with the following columns:
- Scan Name. Shows the name of the scan you've scheduled. To edit the scan, click on the name to go to the scan in Advanced Scan Workbench.
- Run Time. Shows the time the scan is scheduled to run each day (in UTC time).
- Action. Specifies whether the results will be put in a new ChartList, or replace or merge with an existing ChartList.
- List. Shows the name of the ChartList with a link to view the list in Summary View (or in StockChartsACP for ACP ChartLists).
- Last Run. Shows the date and time that the scan was last run (in UTC time).
- Results. Indicates whether or not the last run was successful. May also give more details about whether any results were returned and whether or not the results were truncated due to ChartList size limits.
- Actions. Click the icons to play/pause the scheduled scan, delete the scheduled scan, or edit the scheduled scan.
Are you a Basic StockCharts member? Consider upgrading your membership to Extra or Pro. Extra members can schedule up to 10 scans. Pro members can schedule up to 25 scans.
Keeping Up With the Stock Markets
In the stock markets, no two days are ever the same and you have to work hard to keep up with the market action. When you schedule your scans, you have one less thing to worry about. Yes, it may take some time and effort to create effective scans, but you have lots of resources to help to lower the learning curve.