This is an old revision of the document!
Table of Contents
Working with Scan Results
When you run a scan, the scan results will launch in a new tab or window for you to view. However, that is just the beginning of the process. You will not automatically invest in every stock returned by your scan. There's just no such thing as the perfect scan; there will always be symbols that technically meet the specified criteria, but may not be something you wish to investigate further.
As a result, it is important for you to review your scan results to find the stocks you want to continue watching. The Scan Results page is designed to make this process as streamlined as possible.
Check out our Scan Results overview video below, or just read on to learn how to get the most out of your scan results.
Parts of the Scan Results Page
Whether you are running a scan (Advanced or Standard) or viewing the results of a Predefined Scan, you are presented with essentially the same results page, shown below:
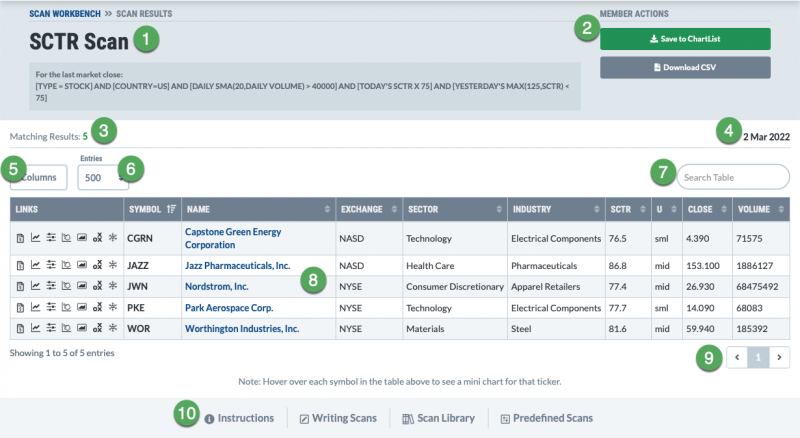
- Scan Criteria/Information
- Available Actions Box
- Number of Results Returned
- Scan Date
- Column Selector
- Entries Per Page
- Search Box
- Results Table
- Previous/Next Buttons
- Additional Resources
The use of each of these sections is described below.
Viewing Scan Criteria/Information
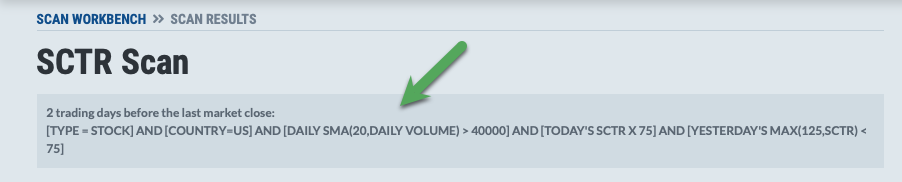
In the Standard and Advanced Scan Results pages, there is a blue Scan Criteria Box at the top of the page that shows the scan name (if it is a saved scan), the scan criteria and any starting date adjustments that have been made.
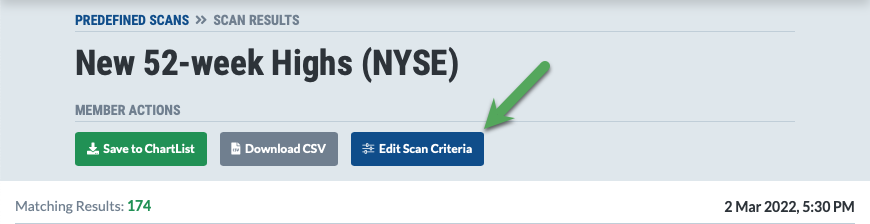
However, for Predefined Scan Results, the scan criteria are not shown directly on the page. Clicking the “Click here to edit this scan” link in the top right corner will load the scan criteria in the Advanced Scan Workbench, allowing you to view the scan clauses, as well as potentially modifying the criteria to save as your own scan:
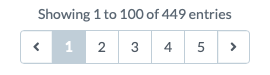
Both the Predefined and Custom Scan Results pages show you the date of the scan and the number of results returned at the top of the page. Remember that, if more than 999 results are returned, only the first 999 will be displayed in the scan results.
Viewing Scan Results
The Results Table
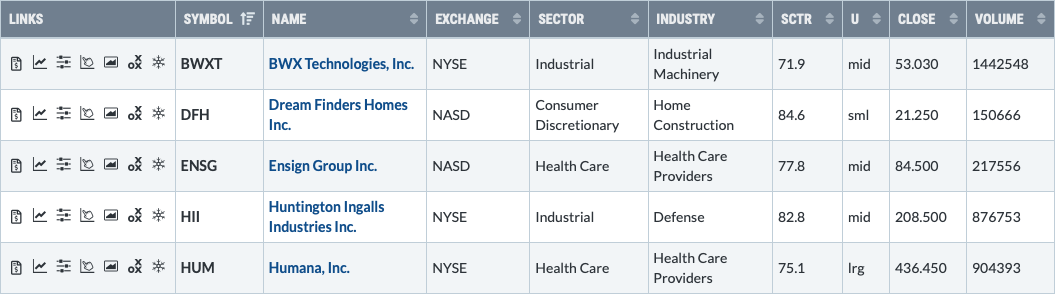
The symbols that meet your criteria are displayed in the Results Table, along with some basic information about each symbol:
- Symbol
- Name
- Exchange
- Sector
- Industry
- SCTR (StockCharts Technical Rank)
- SCTR Universe
- Close
- Volume
In some cases, there is one additional column on the far right, usually displaying an indicator value. If you use a “RANK BY” clause in your Advanced Scan, it will show the value of the indicator or other criteria you ranked by. A few of the Predefined Scans also have an extra column pertaining to that particular scan criteria.
Launching Charts
In the far left column of the Results Table, there are several icons that can be used to launch a chart for that symbol in a new browser window. From left to right, the links launch:
- A default SharpChart
- A SharpChart that attempts to display indicators and overlays used in your scan criteria (not available for Predefined Scan Results)
- A Gallery View chart
Customizing the Results Table
If you don't need all the standard columns in the Results Table, you can click the “Columns” button above the table and click on the columns you want to exclude. Visible columns will be highlighted in blue on this list, while excluded columns will be highlighted in gray. Simply click the column again to toggle it back to visibility.
Additionally, above the Results Table, you can change the number of results that are displayed at one time (the default is 100 results). If you have more results than will fit on the page, “Previous” and “Next” buttons will be available at the bottom of the results table, allowing you to scroll through the pages of results.
Finally, a search box above the Results Table allows you to filter the scan results by keyword.
Sorting Results
By default, the table is sorted by Symbol in descending order. The sorting order will be shown by the icon next to the header text for each column. To change the sort order, you can click on either the icon or the column text. This will toggle the direction (ascending or descending) of the sort.
If your scan uses the “Rank By” feature, the table will be pre-sorted based on your Rank By criteria. If you have used an expression in the Rank By criteria (e.g. ranking by MACD value), an extra column will be displayed on the right side with the value of the expression. For more information on using the Rank By feature, see our Writing Scans page in the Support Center.
The results table supports second order sorting. This allows you to sub-sort a column within another sorted column. For example, you may wish to see the results displayed such that the Industries are shown in order under their respective Sectors. To do that, sort by the Sector column, then hold down the shift key while clicking to sort by the Industry column.
Saving/Exporting Scan Results
There are numerous ways to save your scan results for later use. From the “Available Actions” menu above the Results Table, you can:
- Store the results in a new ChartList.
- Merge the results with an existing ChartList.
- Replace the results of an existing ChartList.
- Download results to a new CSV file.
Storing in a New ChartList
If you select the option to save the results in a new ChartList, you will be prompted to enter a name for said ChartList. The name will be set to “Scan Results” plus today's date, but you can modify or replace this suggestion.
By default, the ChartList will sort the scan results by name. If you want them sorted in the same order as the results table, check the “Preserve Sort Order” checkbox. This ChartList sorting is achieved by prepending numbers to the name of each chart in the ChartList.
Remember that a ChartList can only hold 500 items. If there are more than 500 results for the scan, only the first 500 will be copied to the ChartList. Also, you must have room on your account to add another ChartList.
Merging with an Existing ChartList
The process for merging with an existing ChartList is very similar to storing in a new ChartList. The main difference is that, instead of being prompted to enter a name for your new ChartList, you are asked to select an existing ChartList from a list of all your ChartLists.
Once you select a ChartList and click “OK,” any scan results that are not already on the ChartList will be added to the existing charts on the ChartList, up to a maximum of 500 items. Thus, if you merged with an existing ChartList that had 425 items, at most 75 new charts from the scan results could be added when merging.
Replacing an Existing ChartList
The process for replacing an existing ChartList is also very similar. In this case, you are prompted to select an existing ChartList from a list of all your ChartLists.
Like with the process for storing in a new ChartList, you can check the “Preserve Sort Order” checkbox if you want the ChartList to be sorted in the same order as you have sorted your scan results. Again, this ChartList sorting is achieved by prepending numbers to the name of each chart in the ChartList.
Once you select a ChartList and click “OK,” all existing charts are removed from the ChartList and the scan results are added in their place, up to a maximum of 500 items.
Downloading to a CSV
When you choose this option, your scan results will be saved to a CSV file, which you can download to your computer.
The results in the CSV file will use the same sort order as your Results Table.
Note that the CSV file does not have a 500-item limit like ChartLists, so you can get up to 999 results in the CSV file.
Reviewing/Refining Scan Results
The scan results are not a buy or sell list, but a starting point from which further analysis must be done. This is often an iterative process, wherein viewing the results prompts modifications to the scan criteria based on the number of results and how closely the results approach your desired outcome.
Once you have your scan results and have saved them in a ChartList, it is useful to view that ChartList in CandleGlance view. This will display mini-charts that you can quickly scan.
There are two advantages to the use of CandleGlance view. The first advantage is that you can confirm that the results you are getting are in the ballpark of your desired results. If they are not, further changes to the scan criteria may be required.
Tip: When verifying scan results, we recommend keeping the timeframe of the chart short (2 months or shorter) so it is quicker and easier to see the recent behavior of the price and indicators being verified.
If your results are in the ballpark area, then the second advantage of CandleGlance view is that you can quickly scan the results and eliminate candidates that are not suitable. As you hover your mouse over the upper right corner of the mini-chart, a garbage can link appears. To remove that symbol from the ChartList, simply click on the garbage can, as shown below:
Once this process is complete, you have, in effect, created a watch list. You can extend your review and study the charts in greater depth using Gallery View or other chart formats.
Conclusions
Creating the scan is just the beginning; once you've scanned for a preliminary list of potential investment candidates, you need to review that list and choose those that are worthy of further investigation. The Scan Results page, in combination with ChartLists and CandleGlance charts, can help you do just that.
It's well worth taking the time to learn the “language” we use for writing scans, as this will help you generate a watchlist of stocks custom-tailored to your investment needs. For more information on our scanning syntax, see our Writing Scans article in the Support Center.