Table of Contents
SharpCharts
SharpCharts, our award-winning bar/candlestick charting program, is the signature tool of StockCharts.com and the most widely used feature of the website.
![]() We've rolled out an updated SharpCharts Workbench, the next evolution of our classic charting platform. Check out the new tools, features, and updates and send us your feedback.
We've rolled out an updated SharpCharts Workbench, the next evolution of our classic charting platform. Check out the new tools, features, and updates and send us your feedback.
Overview
A SharpChart is a technical chart that plots price values for a ticker symbol (“dataset”) over time. SharpCharts have a large number of chart settings that can be used to customize the chart, as well as a huge collection of technical indicators and overlays that can be added. A complete description of all of the chart types and technical indicators supported by SharpCharts can be found in the ChartSchool area of our website.
SharpCharts are sent to your web browser as a regular Internet image file (in “png” format), meaning that you can treat a SharpChart exactly the same as you would treat any other Internet-based image. You can copy and paste it into other documents, save it to your hard disk or a photo-organizing program, email it to friends, draw on it with a drawing program, and much more.
Furthermore, you do not have to install any additional browser plug-ins or other software in order to view our charts; they can be viewed on any Internet-connected device that has a web browser.
Creating a SharpChart
SharpCharts can be created using the “ChartBar” found at the top of every page on the website. Simply enter the ticker symbol of the stock you are interested in (or part of its name if you don't know the symbol), select “SharpChart” from the left-side dropdown (if it isn't already selected), and press Enter (or click “Go”).
SharpCharts Format
All SharpCharts have several common visual elements regardless of their settings. These common elements include:
- The Main Ticker symbol
- The Chart Header area
- The Price Plot area
- The Horizontal Time axis
- The Primary Vertical axis
- (Optional) A Secondary Vertical axis
- (Optional) One or more Technical Overlays
- (Optional) One or more Technical Indicator panels
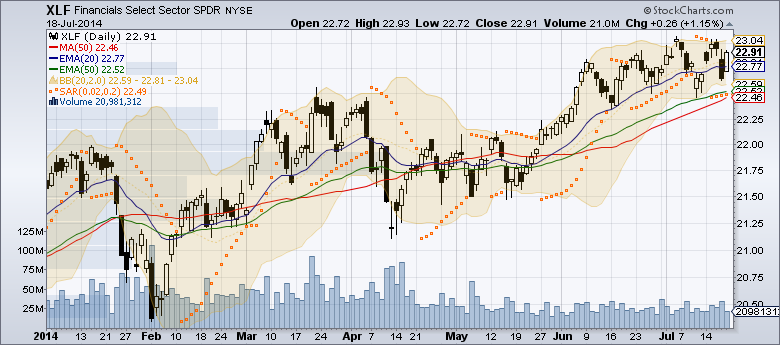
The diagram below shows each of these features on a typical SharpChart:

The information displayed in the Chart Header varies depending on the chart configuration, but, at a minimum, it includes:
- Ticker symbol of the dataset displayed in the Price Plot area
- Date and time of the latest data point (using the time zone of the exchange)
- Open, High, Low and Close (OHLC) values of the latest data point
- Volume for the latest data point
- Change in price since the previous close (see our Percent Change article for more information)
The SharpCharts Workbench
The SharpCharts Workbench is the name of the web page containing all the features you need to create and modify a SharpChart. There are many ways to pull up the SharpCharts Workbench, including:
- Clicking on a ticker symbol anywhere on our website.
- Typing a ticker symbol into the “Create a Chart” box, then clicking “Go.”
- Typing a ticker symbol into the box in the SharpCharts section of the Charts & Tools page, then clicking “Go.”
- Clicking on many of the charts in our Articles and ChartSchool areas.
- Clicking on the SharpCharts icons on our various reports and scan results pages.
In general, you use the workbench by changing one or more of the settings boxes on the page, then clicking one of the “Update” buttons to apply the new settings to your chart. (Note that all of the “Update” buttons do the exact same thing regardless of their position on the page.)
In the upper left corner of the workbench page is the main ticker symbol box. The symbol in that box is always plotted in the main price plot area of the chart. The quote at the top of the chart always corresponds to that main ticker symbol. If you haven't clicked anywhere else on the page, simply typing in a new ticker symbol and pressing “Enter” will show you a chart of the symbol you typed.
Next to the main symbol box is the Period dropdown menu, which lets you select the time duration (i.e. the period) for each bar/candlestick on the chart. Free users can choose between “Daily” and “Weekly” bars; members have access to many more choices, including 1-, 2-, 5-, 10-, 30-, 60- and 120-minute bars, as well as monthly or even yearly bars. For more specifics, please see our Support Center section on Data Bar Periods.
Chart Attributes
Chart Attributes are settings that affect the chart as a whole. These particular settings are contained in the “Chart Attributes” area, located below the chart itself. Here's what that area looks like:
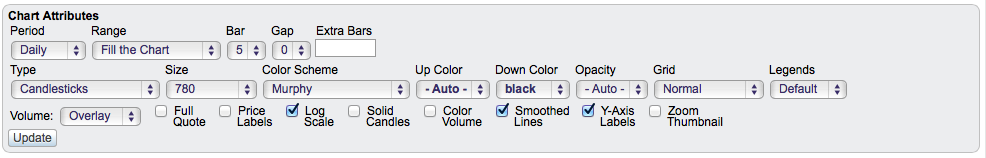
The Period dropdown is the same as the Period dropdown above the chart.
The Range dropdown lets you specify the start and end dates for your chart (i.e., the horizontal axis). There are three different modes for setting a chart's range:
- Fill the Chart mode - for when you want to see the latest data clearly. You specify the bar width and bar gap (in pixels) and we will draw as many bars on the chart as space allows.
- Years/Months/Days mode - for when you want to see a specific amount of recent data. You specify how much time you'd like to be displayed on the chart and we will display that amount of data - compressing/eliminating bars if there is not enough room.
- Select Start/End mode - for when you want to see a time period in the past. You specify the start and end dates as calendar dates and we will display all the data bars between those two dates - scrunching/eliminating bars if there is not enough room. This option also causes the Date Slider to appear, which you can use to change the start and end dates interactively. Learn more in our Support Center article on Using the Date Slider.
The Extra Bars box lets you specify the amount of additional blank space you want available on the right side of the chart. If you don't want any extra space, leave the box blank or enter “0” as the value.
The Type dropdown lets you choose the specific type of chart that you want to see. Examples include OHLC Bar charts, Candlestick charts, Line charts and more. Many of these are described in our ChartSchool articles on Chart Types. We also offer a few specialty chart types (Cumulative, Histogram, Invisible) that are especially well-suited for charting market breadth indicators. Learn more in our Support Center article on Charting Market Breadth Indicators.
The Size dropdown lets you choose the overall width of your chart (in pixels). StockCharts members have different width choices depending on their service level.
The Color Scheme dropdown lets you change the colors that we use to create the chart. Certain color schemes also allow you to change the colors for the entire workbench (i.e., the workbench's “skin”). If one of those schemes is selected, a “Skin” checkbox will appear above the chart, allowing you to turn on that feature.
Up Color/Down Color dropdowns let you change the color of the price bars in the main price plot panel. By default, our candlesticks are colored, but you can set both up and down colors to black if you prefer more traditional uncolored candlesticks.
The Opacity dropdown lets you change how transparent the main price plot is in the main price plot panel.
The Grid dropdown lets you change how many grid lines appear in the background of your chart.
The Legends dropdown lets you change how much information is displayed in the upper left corner of each panel in your chart.
- Off - shows nothing at all in the legend for the main price plot or any indicator panels.
- Minimal - shows the ticker symbol of the security being charted, but no other information.
- Default - shows the ticker symbol of the security being charted, plus information about the indicators and overlays on the chart.
- Verbose - shows the full name of the security being charted, plus information about the indicators and overlays on the chart.
The Volume dropdown lets you easily specify where you want the volume histogram to appear on your chart. For more Volume configuration options, please see our step-by-step tutorial on using the Volume Indicator to display volume.
The Full Quote checkbox adds an information box to the top of your chart that includes additional data about the main ticker symbol, including Bid/Ask data, P/E and EPS ratios, VWAP, SCTR and the sector/industry that the stock belongs to (if available).
The Price Labels checkbox adds data labels at significant peaks and troughs on the chart, showing you the high and low price data for each of those points.
The Log Scale checkbox changes the vertical scale for the Price Plot panel from Arithmetic Scaling (unchecked) to Logarithmic Scaling (checked). Percent changes in price are constant on a log scale chart. For more information, see our ChartSchool article on price scaling.
The Solid Candles checkbox fills in all candlesticks with solid colors instead of using the more traditional hollow candlesticks when prices increase. The color of the candlesticks is based on the relationship between the open and the close. If the close is above the open, the candle is colored with the Up Color; if the close is below the open, the candle is colored with the Down Color.
The Color Volume checkbox causes the bars of the volume histogram to be colored so that they match the chart's price bars.
The Smoothed Lines checkbox causes us to use anti-aliasing techniques to make curved lines appear smoother.
The Y-Axis Labels checkbox adds labels to the primary vertical axis, showing the final value for each indicator line on the chart.
The Zoom Thumbnail checkbox adds a narrow vertical column to the right side of the chart, showing the final 18 time periods for the chart - usually in more detail than on the regular chart.
The Extended Hours checkbox displays extended hours (pre- and post-market) bars on the chart if they are available. Learn more about our Extended Hours Data in the Support Center.
Adding Overlays
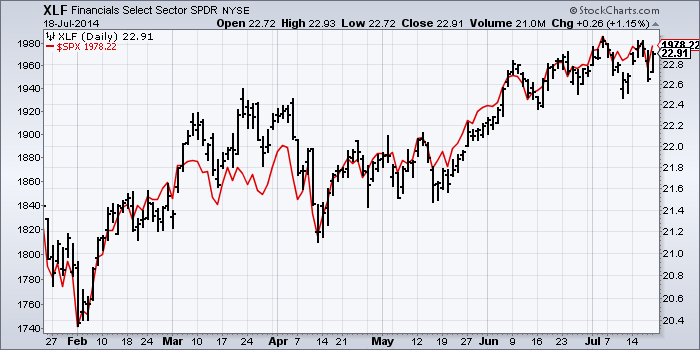
Technical Overlays are lines that are calculated from price and volume data and displayed on top of the main symbol's price bars. They are calculated using the same vertical scale as the price bars. Examples include moving average lines, Bollinger Bands and Pivot Point lines. Here is an example of a chart that includes several overlays:
For detailed information on all of the different technical overlays we offer, please see our ChartSchool articles on overlays.
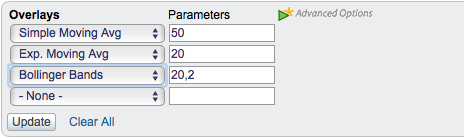
To add an overlay to a SharpChart, use the next available line in the “Overlays” section of the workbench (located just below the Chart Attributes section).
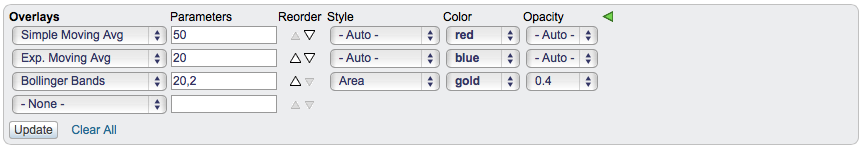
Each line in the Overlays section has a primary dropdown menu (for overlay type selection), a Parameters box and the optional advanced settings boxes. Free users only have access to 3 overlays per chart and cannot use the advanced settings. Members can add up to 25 different overlays to their charts. As soon as the last available overlay line is used, a new line will appear beneath it, allowing you to add more.
The Parameters box allows you to enter whatever parameters the technical indicator needs. Some indicators do not need any parameters, while others support 5 or more different settings via the Parameters box. Individual settings within the box are separated from one another using commas. Many parameters are optional - if you do not specify a particular parameter, a commonly used default setting will be used instead. For more details about the available parameters for each overlay, please see our SharpCharts Parameter Reference.
The Reorder arrows allow you to change the order of the overlay lines displayed on the chart. Just click on an up or down arrow to move the entire overlay line up or down on the list.
The Style dropdown allows members to change the style of the overlay's line. Some of the style options are thin, thick, solid, dashed, area, dots and histogram.
The Color dropdown allows members to change the color of the overlay's line.
The Opacity dropdown allows members to change the transparency of the overlay's line. A setting of 1.0 is completely opaque. A setting of 0.5 is somewhat transparent. A setting of 0.0 is completely transparent (invisible).
Note: if you are not able to see the advanced options (reorder arrows and style/color/opacity dropdowns) for overlays, click the green “Advanced Options” button next to the overlay settings to bring them up.
Finally, there is a “Clear All” link at the bottom of the “Overlays” section. Clicking that link (and then confirming your intentions in a message box that appears) will cause all of the overlay settings for your current chart to be erased.
Adding Indicators
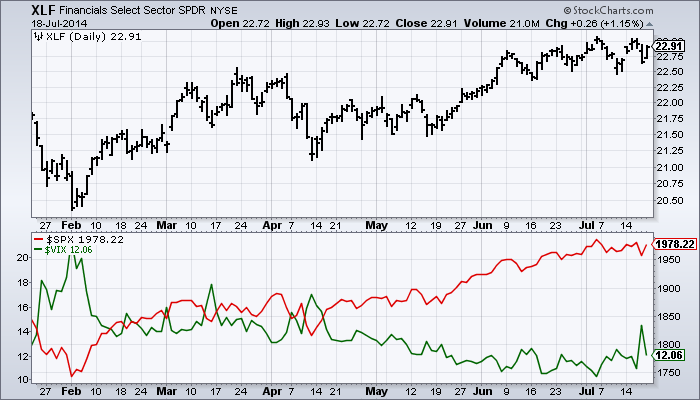
Technical Indicators are lines that are calculated from price and volume data. Indicators differ from overlays in that usually they do not contain price values and are thus plotted on different vertical scales from the price bars. For that reason, they typically appear in separate panels above or below the main price plot area. Some examples of commonly used technical indicators include MACD, RSI and Stochastics. Here is an example chart that contains several technical indicators:
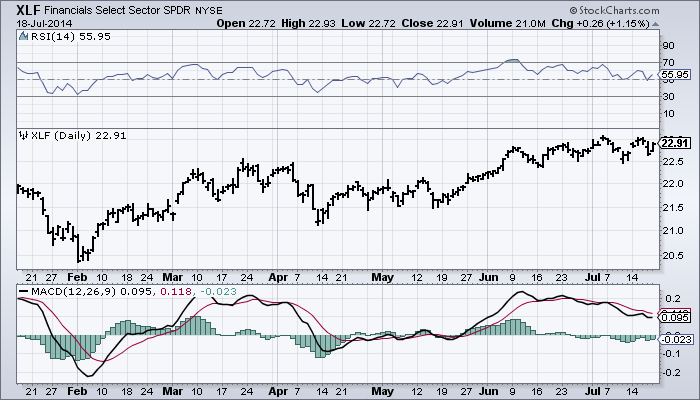
For detailed information on all of the different technical indicators we offer, please see our ChartSchool articles on indicators.
To add an indicator to a SharpChart, use the next available line in the Indicators section of the workbench (located just below the “Overlays” section).
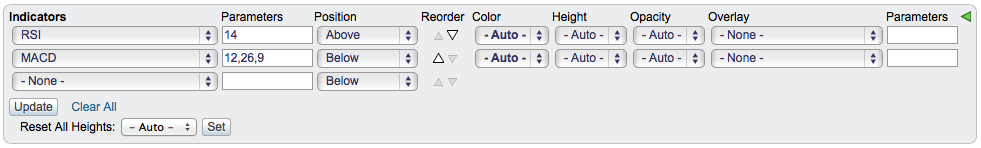
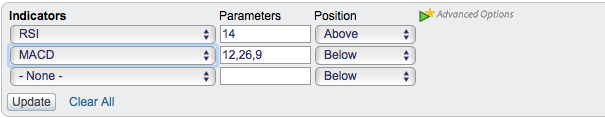
Each line in the “Indicators” section has a primary dropdown menu (for indicator type selection), a Parameters box, a Position dropdown menu and the optional advanced settings boxes. Free users only have access to 3 indicators per chart and cannot use the advanced settings. Members can add up to 25 different indicators to their charts. As soon as the last available indicator line is used, a new line will appear beneath it, allowing you to add more.
The Parameters box allows you to enter whatever parameters the technical indicator needs. Some indicators do not need any parameters, while others support 5 or more different settings via the Parameters box. Individual settings within the box are separated from one another using commas. Many parameters are optional - if you do not specify a particular parameter, a commonly used default setting will be used instead. For more details about the available parameters for each indicator, please see our SharpCharts Parameter Reference.
The Position dropdown allows you to specify whether the indicator appears in a panel above the price plot area, below the price plot area, behind price (i.e. overlaying the price bars inside the price plot area) or behind indicator (i.e. overlaying the indicator immediately above it on the indicator list).
The Reorder arrows allow you to change the order of the indicators displayed on the chart. Just click on an up or down arrow to move the entire indicator up or down on the list.
The Color dropdown allows members to change the color of the indicator's line.
The Height dropdown allows members to choose the height of the indicator panel. The setting defines the vertical size of the indicator panel as a percentage of the height of the main Price Panel.
The Opacity dropdown allows members to change the transparency of the indicator's line. A setting of 1.0 is completely opaque. A setting of 0.5 is somewhat transparent. A setting of 0.0 is completely transparent (invisible).
The Overlay dropdown allows members to add an overlay calculated from the indicator values and displayed directly on the indicator panel. Available overlays include horizontal lines, simple and exponential moving averages, Bollinger Bands, Rate of Change and more. For more information on using this feature, please see our step-by-step instructions for adding overlays to indicators.
The second Parameters box allows members to add any necessary parameters for the overlay chosen from the Overlay dropdown for this indicator. For some overlays, this box can be left empty.
Note: if you are not able to see the advanced options (reorder arrows, color/height/opacity dropdowns, overlay dropdown and parameters box) for indicators, click the green “Advanced Options” button next to the indicator settings.
Finally, there is a “Clear All” link at the bottom of the Indicators section. Clicking that link (and then confirming your intentions in a message box that appears) will cause all of the Indicator settings for your current chart to be erased.
The Price Indicator
There is one special indicator in the Indicator dropdown that we wanted to single out because it is used in many of our charts - the “Price” indicator. This indicator takes a single parameter - a ticker symbol - and adds that symbol's price data to the chart, without doing any calculations per se.
The Price indicator allows you to compare several different ticker symbols - market indicators, indexes or closely related stocks - on a single chart. Here is an example of a chart that uses a Price indicator:
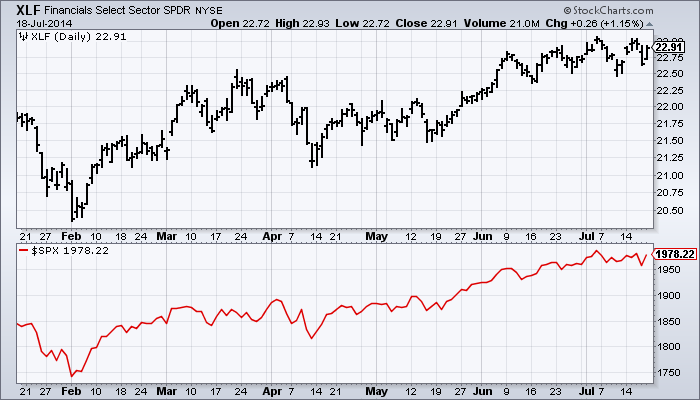
Because they can have a heavy impact on the performance of our servers, there is a limit on the number of ticker symbols (a.k.a. “datasets”) that each chart can have. For free users, that limit is 3. For Basic and Extra members, the limit is 6. For Pro members, the limit is 10.
Step-By-Step Instructions: Displaying More Than One Stock on a Chart
Creating Overlaid Charts
The Price Indicator can be used in conjunction with the “Behind Price” Position setting to create overlaid charts. Here is an example:
In addition, two or more Price indicators can be overlaid on top of themselves using the “Behind Indicator” Position setting. Here is an example:
Step-By-Step Instructions: Creating Overlaid Charts
Performance Comparison SharpCharts
The “Price Performance” indicator is similar to the “Price” indicator, with one key difference - it plots the cumulative percent change in the given ticker symbol starting at the left edge of the chart. This indicator allows you to compare the performance of several different ticker symbols by plotting their Price Performance in an overlaid manner (i.e. using the “Behind Price” Position setting), just as our Interactive PerfChart tool does.
Note: You typically add Price Performance indicators to a chart whose “Type” setting is set to “Performance.”
Here is an example of a Performance SharpChart:
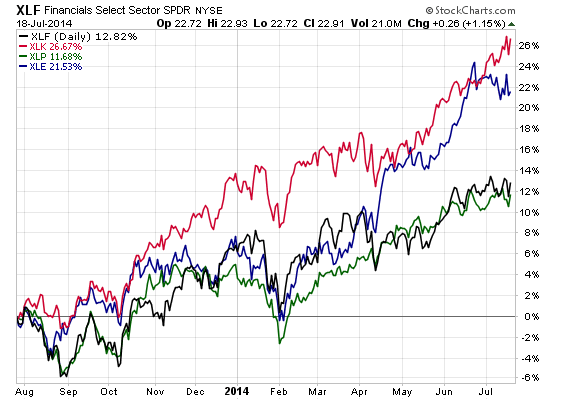
(Click here to see its settings.)
The advantage of creating Performance Charts in SharpCharts is that you can annotate them and/or store them in your account for later review.
Tip: You can also create SharpChart-based Performance Charts quickly by entering several ticker symbols (separated by commas) into the “Create a Chart” box at the top of any of our pages and then pressing “Go.” In addition to being quicker, this approach has the ability to use one of the ticker symbols as the “baseline” of your performance comparison by checking a checkbox. Here is an example of a Baseline Performance Chart.
The Inspector
If you want to examine the data that makes up the bars on a SharpChart, you can check the Inspect checkbox located above the chart, which will cause an interactive cursor to appear. This cursor allows you to see the data values for any of the bars as you move your mouse over them. You can also click and drag your mouse either horizontally or vertically to measure time/price distances between two points. Hold down SHIFT to make the crosshairs appear thinner.
Note: The “Y” data value is the vertical position of the mouse inside the current panel. It can be used to see the values of indicators in panels above or below the price panel.
Note: When the Inspector loads, it re-requests your chart with lots of additional data. That additional data can slow down the chart's loading time significantly. For that reason, you should only enable the Inspector checkbox when you really need it.
Note: Hold down the CTRL (CMD on a Mac) key to make the floating databox become invisible.
Auto-Refresh
You can always update a SharpChart with the latest data by manually clicking the “Update” button on the SharpCharts workbench.
In addition, when the markets are open, the Refresh dropdown allows members to automatically update the data for the SharpChart that is currently on the workbench. The dropdown can be used to specify how frequently the chart updates. Basic and Extra members can have charts update as frequently as once every 15 seconds. Pro members can have charts update as frequently as once every 5 seconds.
By combining our auto-refresh feature with your browser's ability to open multiple tabs/windows, it is possible to create large collections of auto-updating charts. However, before doing that, you need to understand our “chart requests per second” limitation. Essentially, Basic and Extra members cannot automatically request more than 1 chart per second from our servers (on average over an extended period of time). Similarly, Pro members cannot request more than 2 charts per second.
For example, if a Basic member opens 15 different browser tabs and has a SharpChart auto-refreshing every 15 seconds inside each tab, they would be at the limit of what we allow - i.e., 15 charts * (1 chart / 15 seconds) = 1 chart per second. If they then opened up a 16th tab with another auto-refreshing chart in it, they would be in violation of our policy. On the other hand, if they reduced the refresh rate for all of their charts to once every 30 seconds, then they could have up to 30 different charts refreshing at the same time. And so on…
Please see our Excessive Chart Requests Policy for more information.
Frequently Asked Questions
Q: How do I Specify a Start and End Date?
A: To see a chart with a custom time period, you need to adjust the “Range” setting to use “Select Start/End.” Then, you can enter the beginning and end dates you want to see on the chart. This setting is located in the “Chart Attributes” area of the SharpCharts workbench.
After you select that option, you can use a horizontal “Date Slider” to control the beginning and end dates, along with duration. Just click on the middle of the slider and move your cursor to move back and forth in time. Click and hold on one of the ends, then drag your mouse in and out to adjust the duration.
Note that if you specify an end date, the chart will not be updated with any data beyond that date. If you want your chart to update with new data going forward, type (today) in the “End” box.