Table of Contents
Gallery View
Gallery View is a one-page, multi-chart summary of the short-, medium- and long-term view for any stock, index, futures contract or mutual fund in our database. Given any ticker symbol, these charts will be automatically generated with predetermined durations and overlays. This view is useful for in-depth analysis of a single ticker symbol's performance and potential for all types of traders.
Check out our Gallery View overview video below, or just read on to learn how to get the most out of Gallery View.
Creating Gallery View Charts
There are several ways to create a Gallery View chart:
- Create a Chart - At the top of most pages on StockCharts is the “Create a Chart” bar. Select “Gallery View” from the list, enter the symbol and click “Go.”
- Charts & Tools - Supply a symbol in the Gallery View area on the Charts & Tools page.
- Your Dashboard - Choose “GalleryView” from the “View As” dropdown menu in the “Your ChartLists” area to view the members of the ChartList in Gallery View.
- ChartList view - You can also select the Gallery format from the dropdown list when viewing ChartList members.
- Icon Links - Most tables, such as summary tables and scan results, have a column containing icon links. Click the following icon to create a Gallery chart:
Gallery View Chart Components
Gallery View displays several charts (three for non-members, four for members) for a single ticker symbol. Each chart is customized for analysis of a specific timeframe:
- Intraday View (Members-only): 10-minute candlestick chart with bid and ask information, as well as current P/E and EPS values (if available).
- Daily View: Daily candlestick chart with the PPO (a percentage-based version of the popular MACD indicator) and the Chaikin Money Flow indicator.
- Weekly View: Weekly candlestick chart with a long-term PPO graph and the relative strength of the symbol contrasted against the S&P 500.
- Point and Figure View: The current P&F Chart for the symbol using traditional settings.
These indicators and settings are based on recommendations from our Chief Technical Analyst, John Murphy. You can learn more about the various settings that are used in the indicator section of our ChartSchool area.
Note: We recommend using the Gallery View indicators as a starting point for learning about using technical indicators in general. They were chosen because they provide key information that technical analysts should study before making any future price movement projections.
Side-By-Side Gallery View Charts
In order to view Gallery View charts for two symbols at once, simply enter two ticker symbols separated by a comma. The example below shows side-by-side charts for AMZN and $SPX:
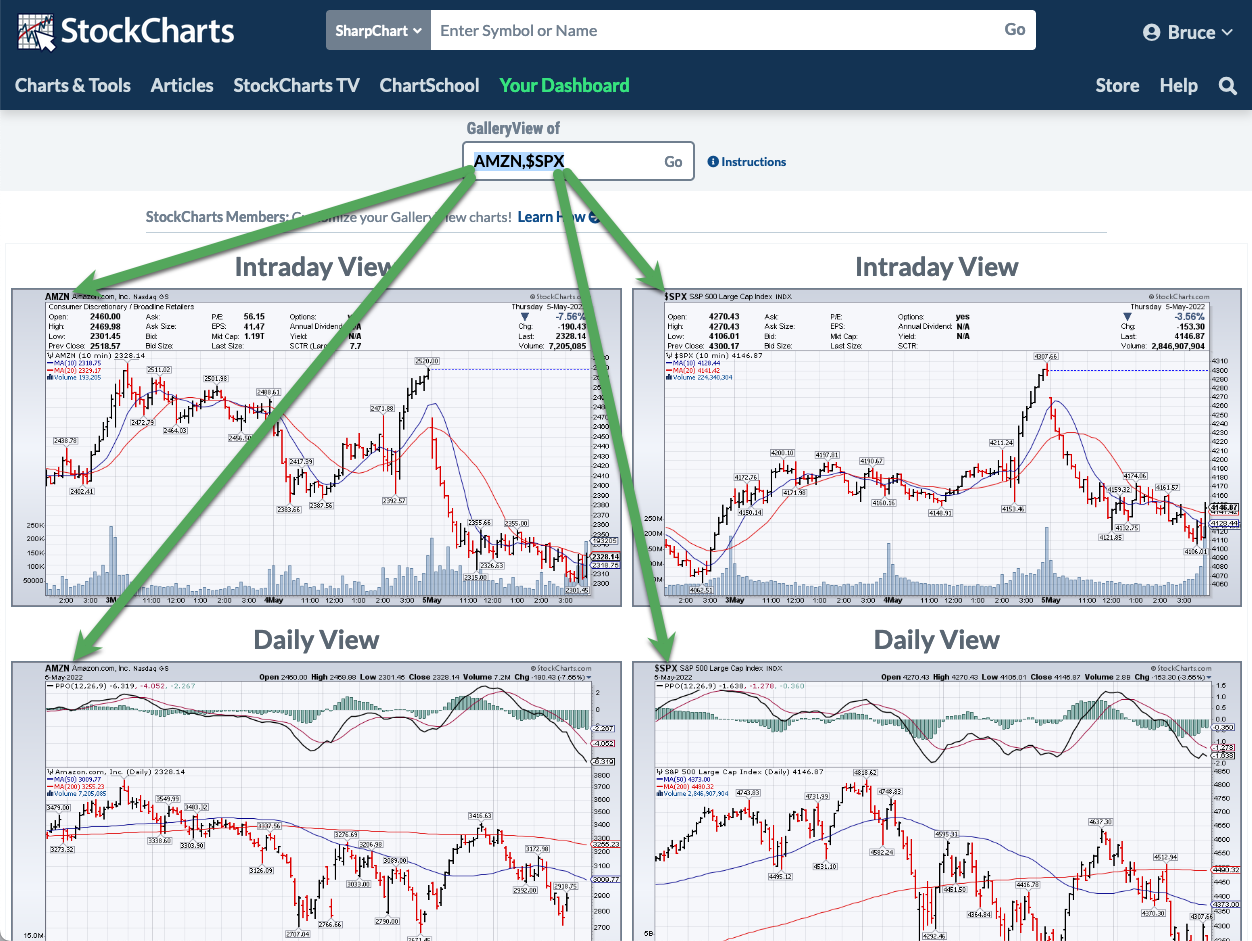
Note: If you are viewing two symbols in side-by-side view, the links at the bottom of the page will take you to charts for the first symbol in the side-by-side comparison.
Customizing Gallery View
Members can customize the settings and indicators used for Gallery View by creating ChartStyles with specific names. If those styles are found in your account, they will be used instead of the default styles when displaying the charts in Gallery View. Here are the names of the styles that, if present, will override the various Gallery View defaults:
- GalleryIntraday
- GalleryDaily
- GalleryWeekly
In other words, to change the way that the Daily chart on the Gallery View page looks, create a chart that looks the way you want your Daily Gallery View charts to look and save it as a ChartStyle named “GalleryDaily.” Visit any of our Gallery View pages and you should now see your new settings/indicators in the Daily chart slot. You can repeat the process for “GalleryIntraday” and “GalleryWeekly” to change those charts.
Please note the following restrictions:
- The Intraday chart will still only show 10-minute bars. Similarly, the Daily chart only shows Daily bars and the Weekly chart only shows weekly bars.
- The P&F chart cannot be customized specifically for Gallery View. However, you can customize the default P&F ChartStyle for all P&F charts; that default P&F ChartStyle will be shown in Gallery View.
- The width of the charts will remain fixed at the current width of 800 pixels.
Here are some tips for creating effective Gallery View ChartStyles:
- Use the “Fill the Chart” range option to prevent the bars on the chart from getting scrunched.
- Consider using different color schemes for each Gallery style to remind you that they contain different bar periods.
- Don't add too many indicators to the Gallery charts; otherwise, the page will get very long.
Viewing ChartLists in GalleryView Format
Members can also use GalleryView charts to view ChartLists. From Your Dashboard, you can select “GalleryView” from the “View As” dropdown next to the ChartList you wish to view. Alternatively, you can switch to GalleryView format from other ChartList formats, such as Summary, ChartBook or CandleGlance. To do so, select “GalleryView” from the “View List As” dropdown.
GalleryView will display charts for one symbol at a time in GalleryView format. At the top of the page, you can use the “Select List” dropdown to choose a different ChartList to display. Use the “Select Chart” dropdown to choose a specific symbol in the ChartList to display. The arrow buttons on either side of this dropdown allow you to quickly cycle through the ChartList's symbols.
For additional functionality, click the “Actions” button to the right of the chart's title. From this menu, you can display the chart as a SharpChart, P&F Chart, GalleryView Chart, Seasonality Chart or PerfChart. There are also links to view historical data, recent data adjustments and articles that mention the main ticker symbol for the chart.
While Edit View provides the most comprehensive set of editing tools for your ChartList, some editing can be done directly from GalleryView:
- Click on the chart's title directly above the chart to edit it. Click the Save button once you've made your changes.
- Add or edit Comments for the chart by clicking in the box directly below the chart. Click the Save button once you've made your changes.
- Similarly, you can add or edit notes for the entire ChartList by clicking in the ChartList Notes box at the bottom of the screen. Click the Save button once you've made your changes.
For more editing functionality, use the “Edit List” button at the top of the screen to load the ChartList in Edit View.
The “Delete List” and “New List” buttons can be used to delete the current ChartList and create a new ChartList, respectively.
Additional Resources
StockCharts In Focus
The following StockCharts In Focus video, “Charting Multiple Timeframes with GalleryView”, takes a deep-dive into all the different ways you can use GalleryView tools on StockCharts, including creating Gallery View charts on both SharpCharts and StockChartsACP.
Next Up » MarketCarpets