Table of Contents
CandleGlance Charts
CandleGlance charts, also known as mini-charts, are a quick way to view a number of ticker symbols in a group. Each chart contains 20- and 50-day simple moving averages by default; these can be viewed over four different timeframes, as well as Point and Figure view.
Check out our CandleGlance overview video below, or just read on to learn how to get the most out of CandleGlance charts.
Creating CandleGlance Groups
Predefined Groups
You can view a number of predefined CandleGlance groups by going to the “Charts & Tools” page and choosing one from the Predefined Groups dropdown menu in the CandleGlance area.
The Market Movers lists on Your Dashboard can also be viewed as CandleGlance groups. From Your Dashboard, choose the group you are interested in from the drop-down menu, then click the “CandleGlance” link in the lower left corner of the Market Movers area.
User-Defined Groups
You can view up to 12 symbols in a user-defined CandleGlance group. From the “Charts & Tools” page, go to the CandleGlance section, enter the symbols separated by commas, and click “Go.”
CandleGlance Controls
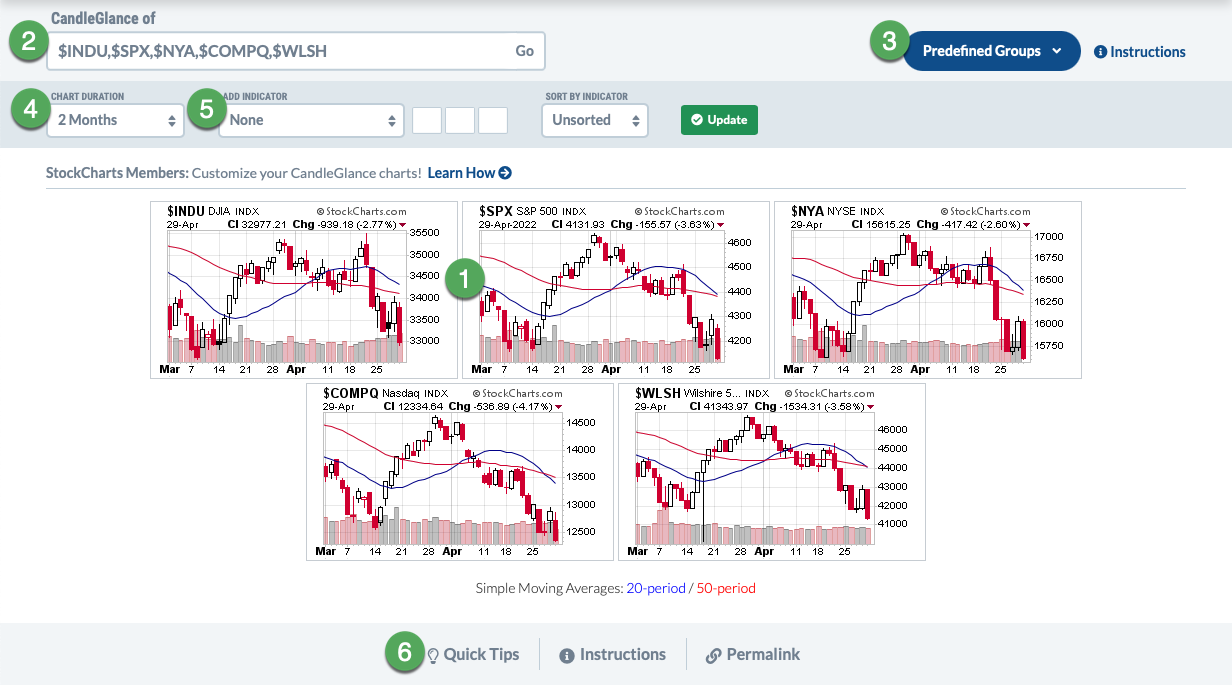
- CandleGlance Chart area
- Symbol list
- Pre-defined group list
- Chart Duration settings
- Indicator & sorting options
- Additional Resources
Customizing CandleGlance
Using the controls in the image above, mini-charts can be customized via the following options:
- Chart Duration - Choose from two-day, two-month, six-month, one-year or P&F views of your charts.
- Indicators - Select one indicator that the charts should be sorted by and adjust parameters as desired. The selected indicator will also be added to the charts.
- Sorting - Choose from ascending or descending order based on the value of the selected indicator. Note that some volume-based indicators only sort after the market has closed.
CandleGlance Style
Members can further customize the settings and indicators used for CandleGlance charts by creating a ChartStyle with a specific name. If a ChartStyle named “CandleGlance” is found in your account, it will be used instead of the default style when displaying CandleGlance charts.
To change the way that charts on the CandleGlance page look, create a chart that looks the way you want your CandleGlance charts to look, then save it as a ChartStyle named “CandleGlance.” If you visit the CandleGlance page, you should now see your new settings/indicators on the charts.
Note that the Chart Duration must be set to “Custom Style” on the CandleGlance page in order to see your custom style.
Viewing ChartLists in CandleGlance Format
Members can also use CandleGlance charts to view ChartLists. From Your Dashboard, you can select “CandleGlance” from the “View As” dropdown next to the ChartList you wish to view. Alternately, you can switch to CandleGlance format from other ChartList formats such as Summary, GalleryView or ChartBook. To do so, select “CandleGlance” from the format dropdown.
The CandleGlance format will display a mini-chart for each of the charts in your ChartList. At the top of the page, you can use the “Select List” dropdown to choose which ChartList to display. As with regular CandleGlance charts, you can customize the chart duration, indicators, and sorting of the mini-charts.
The grey bar with these settings remains on the screen as you scroll down through your saved charts. You can click the “X” in the top right corner of the grey bar to close it and maximize space for charts in your browser window. When you scroll to the top again, the bar will reappear.
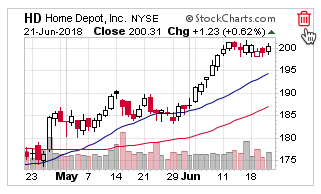
You can delete a chart from the ChartList by hovering the mouse cursor over the upper right corner of the chart. A trash can icon will become visible; clicking on it will delete the chart from the ChartList.
Be aware that clicking the trash can will delete the chart immediately; it will not ask you to confirm that you want to delete it. Use this feature with caution.
You can add or edit notes for the entire ChartList by clicking in the ChartList Notes box at the bottom of the screen. Click the “Save” button once you've made your changes. For more editing functionality, use the “Edit List” button at the top of the screen to load the ChartList in Edit View.
The “Delete List” and “New List” buttons can be used to delete the current ChartList and create a new ChartList, respectively.
Additional Resources
StockCharts In Focus
The following StockCharts In Focus video, “Maximize Your Multi-Chart Views with CandleGlance”, takes a deep-dive into all the different ways you can use CandleGlance tools on StockCharts, creating multi-chart views on both SharpCharts and StockChartsACP.
Next Up » Seasonality Charts