Table of Contents
StockChartsACP Annotations
Overview
StockChartsACP includes several tools for annotating charts. These tools allow you to draw trendlines and other traditional line studies, highlight areas of the chart, and add text notes.
These annotations can be saved to your chart for later study. Once an annotated chart has been saved, its annotations will automatically be repositioned as new data is added to the right side of the chart.
Creating Annotated Charts
Charts can be annotated directly from the StockChartsACP platform. First, create the chart you want to annotate. We recommend that you make sure your chart's settings are correct before you start annotating it. Then click the Annotate (pencil and ruler) icon in the Chart Design menu to begin annotating.
The annotations panel that opens on the left has a complete menu of annotation tools, grouped into categories: Line Tools, Text Tools, Shape Tools, and Line Study Tools. When you click on a tool it opens the Edit Annotation panel. Here you can change the properties of that annotation tool. Below you'll find more details about using the annotation panel and specific annotation tools.

When you're done annotating, simply close the Annotations panel by clicking on the “pencil and ruler” icon again.
Working with Annotations
Adding Annotations
To add an annotation to your chart, select an annotation tool from the menu in the Annotation Panel.

When you select an annotation tool, a panel will open that allows you to change the settings. To add the new annotation, click and drag it on your chart. The example below shows the annotation for a trendline. You can click and drag the trendline on the chart.

Note: While most annotations are added by clicking and dragging, there are a few that use a different method. Those exceptions are described in the instructions for each specific annotation tool.
Annotation Positions
Annotations are positioned relative to the price bars. For example, when you add a trendline to a daily chart, it may extend from February 5th to April 19th. As new price bars are added to the right side of the chart, the price bars for February 5th to April 19th will shift to the left to make room for the new price bars on the right. The annotation will stay with the price bars it was originally attached to.
Note: For some annotations, if part of the annotation moves off-screen, the entire annotation will not be visible. In this situation, you can resize the chart and/or reposition the annotation to make it visible again.
Selecting Annotations
After you add an annotation to a chart, you can edit the annotation's properties. Here's how.
- Hover your mouse over the annotation.
- Select the annotation by clicking on it.
When an annotation is selected, you'll see small circles called “handles” on the outside edges of the annotation. You can click and drag on these handles to change the size and orientation of the annotation.

When you select an annotation, the Edit Annotation panel will open. You can change the properties for that specific annotation in the panel.
In the above example, the trendline annotation is selected so the panel that opens up has settings specific to trendlines. On the Edit Annotation panel, you can change the line color and opacity; modify the line width and style; add an arrowhead to the line; and lock the line in either a horizontal or a vertical position.
Duplicating Annotations
There are three ways to duplicate an annotation:
- Select the annotation, then click the blue Duplicate button at the bottom of the Edit Annotation panel. When you mouse over the chart, a duplicate copy of the annotation will be “stuck” to your mouse. Click the mouse to place the duplicate annotation on the chart.
- Select the annotation, then press CTRL+D (CMD+D on a Mac). When you mouse over the chart, a duplicate copy of the annotation will be “stuck” to your mouse. Click the mouse to place the duplicate annotation on the chart.
- Hold down the CTRL key (CMD on a Mac), then click on the annotation and drag your mouse. Release the mouse button to place the duplicate annotation on your chart.
Deleting Annotations
Once an annotation is selected, it can be deleted by pressing the “Backspace” (or “Delete”) key on your keyboard. You can also delete the selected annotation by clicking the red trash can icon at the bottom of the Edit Annotation panel.
If you want to remove all annotations from a chart, click the red “X” icon at the bottom of the Annotations panel. You will be prompted to confirm that you want to delete all annotations.
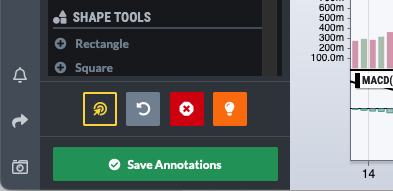
The “Undo” button (grey with a reverse arrow), available at the bottom of the main Annotations panel and all Edit Annotations panels, allows you to undo your most recent change to the annotations on the chart. You can undo several changes by clicking the “Undo” button multiple times. Pressing CTRL+Z (CMD+Z on a Mac) also undoes the most recent annotation change. Please note that there is no “Redo” capability - once the change is “undone,” it is gone forever.
Modifying Annotations
Once an annotation is selected, you can click and drag the handles (the small circles at the edges of the annotation) to resize the annotation. To reposition the annotation, click on the center of the annotation (away from the handles) and drag.
You can also change various properties of the selected annotation in the Edit Annotation panel. The options that you can change vary depending on the annotation selected. They include:
- Color and Opacity - Set the color of the annotation, and how transparent the annotation is. This color picker works just like the one used to set the colors of indicators.
- Line Thickness and Style - Choose from 5 different line widths and 3 different line styles.
- Lock Horizontally/Vertically - Many of our line annotations allow you to lock the line into a perfectly vertical or perfectly horizontal position.
- Font Size and Style - Choose the size of the font, and whether the text should be bold and/or italicized in your text annotations.
- Fill Mode - Toggle between two different approaches for filling shapes: unfilled, or filled with a semi-transparent color of your choice.
- Display All Values - Many of our line studies annotations allow you to choose whether to display additional informational labels on the annotation or not.
Note: Some annotations have additional settings that are specific to that tool. Those settings are described in the instructions for each specific annotation tool.
Saving Annotations
When you save a chart to a ChartList in StockChartsACP, any annotations are saved along with the chart.
The green Save Annotations button at the bottom of the Annotations panel allows you to save new changes to annotations as you work on the chart. The process is identical to saving a chart without annotations.
If the chart has not been saved to a ChartList before, you will be prompted to select a ChartList and provide a name for the chart you are saving.
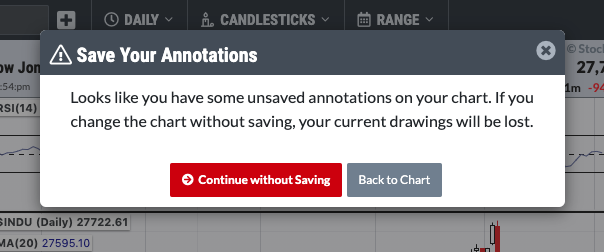
If you attempt to leave a chart that has unsaved annotations on it, you will be given the opportunity to save the chart before moving on to the new one.
Non-members cannot save annotated charts to their account (since they do not have an account), but they can use a screenshot tool to create a static snapshot of their annotated chart.
Types of Annotations
The annotation tools in StockChartsACP are grouped into the following categories: Line Tools, Text Tools, Shape Tools, and Line Studies. Click on the appropriate link to learn more about using each group of tools.
Line Tools
Line tools are annotation tools that create lines on your chart and/or allow you to measure on your chart. These include trendlines, vertical and horizontal lines, channels, parabolas, auto support/resistance lines, and measurement tools such as average and percent change. Learn more about using these tools in our Support Center article on StockChartsACP Line Tools.
Text Tools
Our text annotation tools allow you to add text to your chart. These include text notes and callout boxes. Learn more about using these tools in our Support Center article on StockChartsACP Text Tools.
Shape Tools
Our shape tools allow you to create filled or hollow shapes on your chart. These tools include rectangles, ellipses, triangles, arrows, checkmarks, and stars. Learn more about using these tools in our Support Center article on StockChartsACP Shape Tools.
Line Studies
We also offer additional line study annotation tools. These tools include Fibonacci-based line studies (retracements, arcs, fans, and time zones), cycle studies (cycle lines, cycle circles, and sine waves), and other popular line studies such as Harmonic Patterns (XABCD), Raff Regression Channels, Andrews' Pitchforks, Quadrant Lines, and Speed Resistance Lines. Learn more about these tools in our Support Center article on StockChartsACP Line Study Tools.