Table of Contents
StockCharts Technical Rank (SCTR) Reports
The StockCharts Technical Ranks (abbreviated “SCTRs,” pronounced “scooters”) are a relative strength metric that rates a security's technical strength against that of its peers. StockCharts offers several different SCTR-based reports.
Check out our SCTR overview video below, or just read on to learn how to get the most out of SCTR reports.
SCTR Ranking Process
Securities are ranked through a process in which they are grouped into “universes” and given a relative SCTR ranking within their respective universe, based on a number of technical criteria.
The current set of SCTR universes include:
- US Large-Cap
- US Mid-Cap
- US Small-Cap
- US ETFs
- US Industries
- Toronto Exchange
- London Exchange
- India Exchange
A score from 0.0 to 99.9 is given to each member of each universe based on that member's technical strength. A score of 99.9 represents the best-performing stock in the universe, while 0.0 is the worst performer.
For more details on SCTRs and how they can be interpreted, please see the ChartSchool SCTR article.
SCTR Top Ten Reports on Your Dashboard
The data panels of Your Dashboard can be configured to display SCTR “Top Ten” reports showing the highest and lowest ranked SCTRs for several universes, including the US Large-Cap, US Mid-Cap, US Small-Cap, US ETF, US Industries, Toronto, London and India SCTR universes.
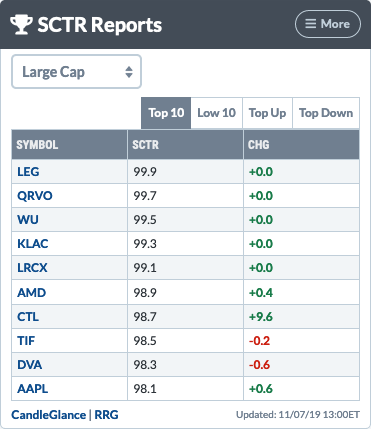
Using the tabs above the report, you can switch between viewing the top 10 highest, lowest, most improved or least improved SCTR values for that universe.
Click on an individual symbol name to view a SharpChart for that symbol.
Additional links at the bottom of the box allow you to see a CandleGlance or RRG Chart with the symbols in the currently-selected Top Ten view.
SCTR Summary Report
The SCTR Summary Report allows you to view all the members of the selected universe, rather than just the top ten.
Accessing the SCTR Summary Report
The SCTR Summary Report can be accessed from either the “Member Tools” section of Your Dashboard or from the “Summary Pages” section of the Charts & Tools page.
Using the SCTR Summary Report
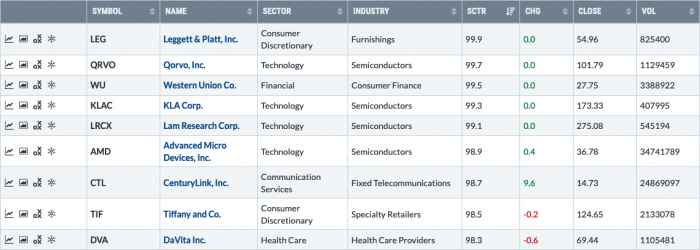
The SCTR Summary Report table will show each stock's SCTR score and how that score has changed since the last trading day. StockCharts members will have access to intraday scores, which are updated every 2-3 minutes during market hours.
Hover over a ticker symbol to display a mini chart for that symbol. This is a great way to quickly preview multiple stocks on the list without ever leaving the SCTR Report page.
Click the appropriate icon in the left column of each row in order to display the symbol in a full-scale SharpChart, Gallery View, Point and Figure or Seasonality chart.
Additional List Functionality
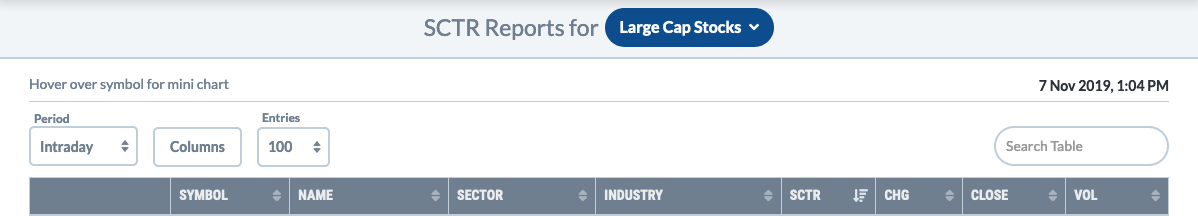
The SCTR Summary Report has the same functionality as most of the lists on our site:
- To show or hide columns in the list, click the “Columns” button at the top.
- To sort by a different column, click the double-arrow icon next to the column header.
- To sort by multiple columns (e.g. sort by column A, and within each value for A, sort by column B), click the first column, then hold down the shift key while selecting the second column.
- You can also search the items in the list by typing in the “Search Table” box at the top right.
Additional Resources
StockCharts In Focus
The following StockCharts In Focus video, “Pinpoint the Strongest Stocks with SCTRs”, takes a deep-dive into all the different ways you can use SCTRs on StockCharts, including the SCTR reports, scanning for SCTRs, and charting with SCTRs on both SharpCharts and StockChartsACP.
Next Up » Cryptocurrency Summary