Table of Contents
ChartLists and ChartPacks
Overview
ChartLists are “online folders” that allow members to store up to 1000 charts in a single group. You must be a StockCharts member to use ChartLists. Basic members can only have one ChartList, while Extra members can have up to 250 different ChartLists and Pro members can have up to 500 different lists.
ChartLists allow you to group/organize/categorize collections of charts. A ChartList can contain the major market symbols, sector/industry symbols, international ETFs, your current holdings, watch lists, closed trades or any other collection of related charts that you can imagine.
Check out our ChartLists overview video below, or just read on to learn how to get the most out of ChartLists.
Uses for ChartLists
The charts and ticker symbols inside a ChartList can be accessed in a number of ways, as we will see below. In addition, they can be be used in Technical Scans and Technical Alerts.
Extra and Pro members can make one of their ChartLists viewable to the public. These “Public ChartLists” are a great way to share your technical analysis expertise with other members.
StockCharts also provides a large number of pre-created ChartLists that you can easily add to your account with just a couple of clicks. Said ChartLists are called “ChartPacks.”
Learn More: Public ChartLists | ChartPacks
Creating New ChartLists
Check out our video about creating new ChartLists, or read on for more details.
Note: Members of our Basic service level are limited to just one ChartList and that ChartList cannot be removed. Therefore, information about creating/deleting ChartLists does not apply to Basic members.
Note: All accounts come with (at least) one pre-created ChartList called the “Default List.”
There are several ways to create a new ChartList and add it to your account:
- From Your Dashboard, you can click the “New” button in the “Your ChartLists” area.
- If you are using any of the ChartList Views to view an existing list, you can also click the “New List” button at the top of the page.
- You can store the results from a Technical Scan in a new ChartList.
When creating a new ChartList, a dialog will display asking for the list name. A ChartList's name can contain up to 100 characters. Once the list has been created, you will be shown the new list in “Edit” view.
Deleting ChartLists
ChartLists can be deleted using the Delete button at the top of any of the ChartList views. Multiple lists can be deleted at once from the Your ChartLists section of Your Dashboard. For more information on this process, please see the Your Dashboard article in the Support Center.
Saving SharpCharts
After you have created a ChartList, there are several ways to save a SharpChart into that ChartList:
- Use the “Save” or “Save As” links on the SharpCharts Workbench. (More on saving charts from the SharpCharts Workbench)
- Click the “Save” button in the ChartNotes window. (More on saving annotated charts)
- Save the results of a Scan into a ChartList. (More on Saving Scans)
- Use the “Edit View” commands to move or copy existing charts between ChartLists. (More on Edit View)
Saved charts must be saved into a ChartList and must have a name. When saved charts are displayed in order, they are shown in alphabetic order by name.
Reminder: A maximum of 1000 charts can be saved to each ChartList. Once the ChartList has reached that limit, no more charts can be saved until some are removed from the list. A notification will be displayed on the SharpCharts Workbench and on ChartList views if you have reached this limit.
Viewing Saved Charts
Check out our video about viewing the charts saved in your ChartLists, or read on for more details.
Once you have saved a chart into a ChartList, you can view it again either inside the SharpCharts Workbench, on Your Dashboard, or via any of the “ChartList Views” listed below.
Using the SharpCharts Workbench
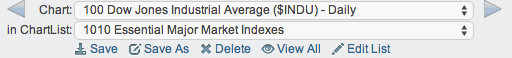
To see a saved chart from inside the SharpCharts Workbench, use the “Chart” dropdown located above the current chart to select any saved charts from the current ChartList. (Use the “in ChartList” dropdown to change the current ChartList.)
You can also click on the blue triangles on either side of the “Chart” dropdown to quickly move one chart forward or backward within the current ChartList.
Tip: Pressing the “Ctrl+>” and “Ctrl+<” keys on your keyboard will also move you forward and backward within the current ChartList.
Using Your Dashboard
You can choose to display mini summary views of up to two ChartLists and highlight up to three saved charts on Your Dashboard, using our ChartList Panels and Chart Panels features. These features can be enabled by clicking the “gears” icon at the top right of the dashboard, and making sure the “ChartList Panels” and/or “Chart Panels” options are selected.
Learn More: ChartList Panels | Chart Panels
Using ChartList Views
ChartList Views are different ways of examining your saved charts. In some views, you can see the actual charts that you saved. For example, ChartBook view shows you each of your saved charts one at a time. Other views just use the main ticker symbols from each saved chart as input into a different analysis tool. For example, the Summary view shows you a table of all the ChartList's symbols on one page.
The following views can be accessed from the 'View As' dropdown on Your Dashboard for a given ChartList. When looking at a ChartList in a specific view, you can also switch to a different view using the dropdown at the top of the page. Click on a view name below for more information about using that view.
- Summary View - A table view showing price, performance, SCTR, and optional technical/fundamental data for all of the ChartList's ticker symbols.
- ChartList View - Display your saved charts 5, 10, 25, 50, or 100 at a time, or scroll through an infinite feed of all the charts in your ChartList.
- ChartBook View - Displays your saved charts one at a time.
- Gallery View - Displays a GalleryView page for each ticker symbol in your ChartList.
- CandleGlance View - Displays a CandleGlance page showing mini-charts for all of the ChartList's ticker symbols on a single page.
- Symbol Summary View - Displays a Symbol Summary for each ticker symbol in your ChartList.
- Performance View - A table view showing price performance history for all of the ChartList's ticker symbols across multiple timeframes.
- Seasonality View - Displays a Seasonality Chart for each ticker symbol in your ChartList.
- MarketCarpet View - Displays a MarketCarpet created from the ChartList's ticker symbols.
- Correlation View - A table view showing correlation of each of the ChartList's ticker symbols to another symbol of your choice.
- Edit View - Allows you to edit/modify the ChartList's contents.
Note: You can access the “10 Per Page” view directly from the SharpCharts Workbench by clicking the “View All” link located just above the chart. Similarly, you can directly access the “Edit” view by clicking the “Edit List” link. (See image above)
Editing Saved Charts
Edit View allows you to change the name and properties of a ChartList. It also lets you do “bulk” operations on the charts in a ChartList. For example, you can use Edit View to change the ChartStyle of several charts all at once rather than editing them one at a time.
For more information and an in-depth video on editing your ChartLists and saved charts with Edit View, please see our Edit View article in the Support Center.
Organizing Saved Charts
Check out our video about organizing the charts in your ChartLists, or read on for an overview and step-by-step instructions.
As mentioned above, saved charts are displayed in alphabetical order based on their name. You can control the order in which your charts appear by including a numeric code at the front of each chart's name. We recommend using a 4-digit code for organizing your charts. Be sure to include the starting zeros to ensure things sort correctly, e.g. “0000,” “0200,” “0950,” etc.
Step-By-Step Instructions: Rearranging Order of Charts
The StockCharts ChartList Framework
The StockCharts ChartList Framework is an optional set of ChartLists designed to help organize your own ChartLists. As you create more and more ChartLists, it is easy for your account to get a bit “cluttered,” which makes it harder to find ChartLists later. The StockCharts ChartList Framework provides one way to keep your ChartLists organized regardless of how many you create.
The framework consists of empty ChartLists which act as dividers for different groups of ChartLists. These are numbered in a way that reflects how many people work with charts over time. Here is more information on how the framework can help you stay organized.
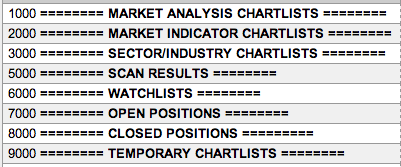
You can install the StockCharts ChartList Framework using the link for the framework located near the bottom of the “ChartPacks” page.
Once the framework is installed, additional ChartLists can be created and numbered such that they will be grouped within the appropriate area of the framework, making them easier to find later. For example, the 3000 area should be used for ChartLists that contain sector and industry analysis charts.
Note: Use of the StockCharts ChartList Framework is completely optional. If you have a method for organizing ChartLists that works well for you, we recommend that you continue using it. The framework is offered as a resource for people that do not have a ChartList organization method that they are happy with.
Searching for ChartLists
If you cannot remember which ChartList you saved a particular chart to, you can use our search functionality to look for it. Simply type the ticker symbol in the search box at the top right of any page on our site and press Enter.
When the search results page displays, it will be searching for Support Articles by default. Simply click the grey button that says “Support Articles” and select “My Saved Charts” from the list instead. For detailed step-by-step instructions, check out our Support Center article on searching for charts in your ChartLists.
Receiving ChartList Reports
ChartList Reports are a great way to monitor your ChartLists. Once you turn on ChartList Reports for one of your lists, you'll receive daily and/or weekly performance summaries of all the securities on that list in your email inbox. These reports can be used to monitor your portfolio(s), track your own unique set of market indexes, follow specific groups like the Dow Industries, and more.
For more information on setting up ChartList Reports for your own lists, please see our ChartList Reports article in the Support Center.